Variability
What is Variability
Variability refers to
- how much the numbers in a distribution differ from each other.
- how "spread out" a group of scores is.
The terms variability, spread, and dispersion are synonyms, and refer to how spread out a distribution is.
Quiz Example
Quiz1
Quiz2
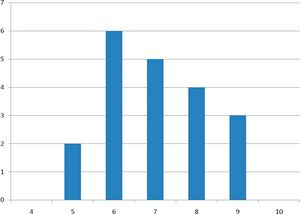
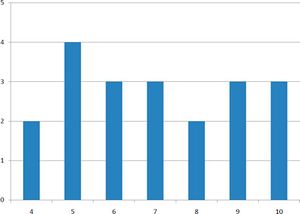
- The graphs above represent the scores on two quizzes.
- The mean score for each quiz is 7.0.
- Despite the equality of means, you can see that the distributions are quite different.
- Specifically, the scores on Quiz 1 are more densely packed and those on Quiz 2 are more spread out.
- The differences among students were much greater on Quiz 2 than on Quiz 1.
Measures of Variability
There are four frequently used measures of variability: the range, interquartile range, variance, and standard deviation.
Range
- The range is the simplest measure of variability to calculate, and one you have probably encountered many times in your life.
- The range is simply the highest score minus the lowest score.
Example 1
- What is the range of the following group of numbers: 10, 2, 5, 6, 7, 3, 4?
- The highest number is 10, and the lowest number is 2, so 10 - 2 = 8.
- The range is 8.
Example 2
- Here’s a dataset with 10 numbers: 99, 45, 23, 67, 45, 91, 82, 78, 62, 51.
- The highest number is 99 and the lowest number is 23, so 99 - 23 equals 76; the range is 76.
Quiz Example
- Vonsider the two quizzes shown in the graphs above.
- On Quiz 1, the lowest score is 5 and the highest score is 9; the range is 4.
- On Quiz 2, the lowest score is 4 and the highest score is 10; the range is 6.
- The range on Quiz 2 was larger
Interquartile Range
- The interquartile range (IQR) is the range of the middle 50% of the scores in a distribution.
- It is computed as follows:
IQR = 75th percentile - 25th percentile
Quiz Example
- For Quiz 1, the 75th percentile is 8 and the 25th percentile is 6; The interquartile range is 2.
- For Quiz 2, which has greater spread, the 75th percentile is 9, the 25th percentile is 5, and the interquartile range is 4.
- In box plots, the 75th percentile was called the upper hinge and the 25th percentile was called the lower hinge.
- Using this terminology, the interquartile range is referred to as the H-spread.
semi-interquartile range
- The semi-interquartile range is defined simply as the interquartile range divided by 2.
- If a distribution is symmetric, the median plus or minus the semi-interquartile range contains half the scores in the distribution.
Variance
- Variability can also be defined in terms of how close the scores in the distribution are to the middle of the distribution.
- Using the mean as the measure of the middle of the distribution, the variance is defined as the average squared difference of the scores from the mean.
Population Variance
The formula for the variance is:
 where σ2 is the variance, μ is the mean, and N is the number of numbers
Quiz Example
The data from Quiz 1 are shown in Table below.
| Scores | Deviation from Mean | Squared Deviation |
|---|---|---|
| 9 | 2 | 4 |
| 9 | 2 | 4 |
| 9 | 2 | 4 |
| 8 | 1 | 1 |
| 8 | 1 | 1 |
| 8 | 1 | 1 |
| 8 | 1 | 1 |
| 7 | 0 | 0 |
| 7 | 0 | 0 |
| 7 | 0 | 0 |
| 7 | 0 | 0 |
| 7 | 0 | 0 |
| 6 | -1 | 1 |
| 6 | -1 | 1 |
| 6 | -1 | 1 |
| 6 | -1 | 1 |
| 6 | -1 | 1 |
| 5 | -2 | 4 |
| 5 | -2 | 4 |
| Means | ||
| 7 | 0 | 1.5 |
- The mean score is 7.0.
- Therefore, the column "Deviation from Mean" contains the score minus 7.
- The column "Squared Deviation" is simply the previous column squared.
- The mean deviation from the mean is 0. This will always be the case.
- The mean of the squared deviations is 1.5.
- Therefore, the variance is 1.5.
- Analogous calculations with Quiz 2 show that its variance is 6.7.
- Using the formula, for Quiz 1, μ = 7 and N = 20.
Sample Variance
- If the variance in a sample is used to estimate the variance in a population, then the formula for Population Variance underestimates the variance and the following formula should be used is below.
 where s2 is the estimate of the variance and M is the sample mean.
- Note that M is the mean of a sample taken from a population with a mean of μ.
- Since, in practice, the variance is usually computed in a sample, this formula is most often used.
Example
- Assume the scores 1, 2, 4, and 5 were sampled from a larger population.
- To estimate the variance in the population you would compute s2 as follows:
 M = (1 + 2 + 4 + 5)/4 = 12/4 = 3.
 s2 = [(1-3)2 + (2-3)2 + (4-3)2 + (5-3)2]/(4-1)
    = (4 + 1 + 1 + 4)/3 = 10/3 = 3.333
Alternate Formulas
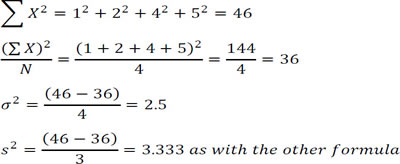
- There are alternate formulas that can be easier to use if you are doing your calculations with a hand calculator.
- These formulas are subject to rounding error if your values are very large and/or you have an extremely large number of observations.
For the example above,
Standard Deviation
- The standard deviation is the square root of the variance.
Quiz Example The standard deviations of the two quiz distributions 1.225 and 2.588.
Standard Deviation and Normal Distribution
- The standard deviation is an especially useful measure of variability when the distribution is normal or approximately normal because the proportion of the distribution within a given number of standard deviations from the mean can be calculated.
- 68% of the distribution is within one standard deviation of the mean and approximately 95% of the distribution is within two standard deviations of the mean.
- Therefore, if you had a normal distribution with a mean of 50 and a standard deviation of 10, then 68% of the distribution would be between 50 - 10 = 40 and 50 +10 =60.
- Similarly, about 95% of the distribution would be between 50 - 2 x 10 = 30 and 50 + 2 x 10 = 70.
- The symbol for the population standard deviation is σ; the symbol for an estimate computed in a sample is s.
Example
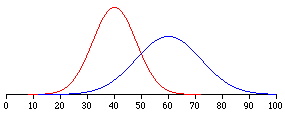
Figure above shows two normal distributions.
- The red distribution has a mean of 40 and a standard deviation of 5
- The blue distribution has a mean of 60 and a standard deviation of 10
- For the red distribution, 68% of the distribution is between 35 and 45
- for the blue distribution, 68% is between 50 and 70.
Quiz
<quiz display=simple > { What is the range of 2, 4, 6, and 8?
|type="{}"} { 6 }
{
Answer >>
6
8 - 2 is 6
}
{Would the variance of 10, 12, 17, 20, 25, 27, 42, and 45 be larger if the numbers represented a population or a sample?
|type="()"} -Population +Sample
{
Answer >>
Sample
The variance would be larger if these numbers represented a sample because you would divide by N-1 (instead of just N).
}
{What is the standard deviation of this sample?
Y
 8
15
20
12
13
11
13
15
|type="{}"} { 3.5026 }
{
Answer >>
3.5026
}
{What is the interquartile range of these numbers?
Z
12
13
14
15
 9
10
16
10
 8
10
11
12
13
22
23
24
25
|type="{}"} { 9 }
{
Answer >>
9
25th% is 10, 75th% is 19, 19 - 10 is 9
}


