Statistics for Decision Makers - 14.06 - Regression - Non-linear Regression
Jump to navigation
Jump to search
<slideshow style="nobleprog" headingmark="。" incmark="…" scaled="false" font="Trebuchet MS" footer="www.NobleProg.co.uk" subfooter="Training Courses Worldwide">
- title
- 14.06 - Regression - Non-linear Regression
- author
- Bernard Szlachta (NobleProg Ltd) bs@nobleprog.co.uk
</slideshow>
Non Linear Regression。
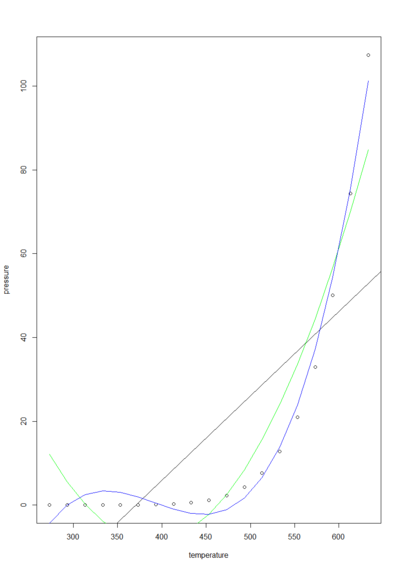
 p <- read.csv("http://training-course-material.com/images/4/4f/Pressure.txt",h=T)
 options(show.signif.stars=F)
 m1 <- lm(pressure  ~ temperature, data=p)
 plot(p)
 abline(m1)
 summary(m1)

 m2 <- lm(pressure  ~ temperature + I(temperature^2), data=p)
 lines(p$temperature,predict(m2),col="green")
 summary(m2)

 m3 <- lm(pressure  ~ temperature + I(temperature^2) + I(temperature^3), data=p)
 lines(p$temperature,predict(m3),col="blue")
 summary(m3)
Non Linear Regression。
Nonlinear Regression model output 。
- m1
lm(formula = pressure ~ temperature, data = p)
            Estimate Std. Error t value Pr(>|t|)
(Intercept) -74.7835    19.6282  -3.810 0.001400
temperature   0.2016     0.0421   4.788 0.000171

Multiple R-squared:  0.5742,	Adjusted R-squared:  0.5492
p-value: 0.000171
- m2
lm(formula = pressure ~ temperature + I(temperature^2), data = p)
                   Estimate Std. Error t value Pr(>|t|)
(Intercept)       2.272e+02  4.229e+01   5.373 6.22e-05
temperature      -1.214e+00  1.941e-01  -6.255 1.15e-05
I(temperature^2)  1.562e-03  2.129e-04   7.336 1.67e-06

Multiple R-squared:  0.9024,	Adjusted R-squared:  0.8902
p-value: 8.209e-09
- m3
lm(formula = pressure ~ temperature + I(temperature^2) + I(temperature^3),data = p)
                   Estimate Std. Error t value Pr(>|t|)
(Intercept)      -4.758e+02  6.580e+01  -7.232 2.92e-06
temperature       3.804e+00  4.628e-01   8.219 6.16e-07
I(temperature^2) -9.912e-03  1.050e-03  -9.442 1.06e-07
I(temperature^3)  8.440e-06  7.703e-07  10.957 1.48e-08

Multiple R-squared:  0.9892,	Adjusted R-squared:  0.987
p-value: 5.889e-15
Nonlinear Regression model output 。
Adjusted R2。
- Adjusted R2 is AKA , "R bar squared"
- Adjusted R2 spuriously increases when extra explanatory variables are added to the model
- Adjusted R2 >= R2
- It penalizes for more predictor variables
Model over-fitting。
- The polynomial function passes through each data point (if the number of the coefficients matches the number of points less one)
- If regression curves had been used to extrapolate the data, the overfit would have a bigger error of prediction
- The over-fitted model has less predictive power
Quiz …。
In all cases, the higher the R2 the better: True or False?
- False


