Statistics for Decision Makers - 14.05 - Regression - Multiple Regression
Jump to navigation
Jump to search
<slideshow style="nobleprog" headingmark="。" incmark="…" scaled="false" font="Trebuchet MS" footer="www.NobleProg.co.uk" subfooter="Training Courses Worldwide">
- title
- 14.05 - Regression - Multiple Regression
- author
- Bernard Szlachta (NobleProg Ltd) bs@nobleprog.co.uk
</slideshow>
Introduction to Multiple Regression。
- Simple linear regression - one predictor variable
- Multiple regression - two or more predictor variables
- Example
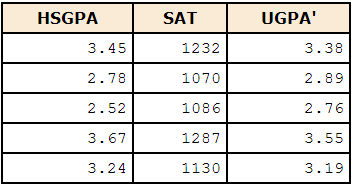
We want to predict a student's university grade point average (UGPA) on the basis of their High-School GPA (HSGPA) and their total SAT score
- We try find a linear combination of HSGPA and SAT that best predicts University GPA (UGPA)
- I.e. find the values of b1 and b2 in the equation shown below that give the best predictions of UGPA (OLS)
UGPA' = b1 x HSGPA + b2 x SAT + A
where UGPA' is the predicted value of University GPA
A is a constant
b1, b2 are regression coefficients or regression weights

In this case:
UGPA' = 0.541 x HSGPA + 0.008 x SAT + 0.540
Multiple Correlation。
- The multiple correlation (R) is equal to the correlation between the predicted scores and the actual scores
- In this example, it is the correlation between UGPA' and UGPA
R = 0.79
R is always positive
Assumptions。
- No assumptions are necessary for computing the regression coefficients
- Moderate violations of Assumptions 1-3 do not pose a serious problem for testing the significance of predictor variables
- Even small violations pose problems for confidence intervals
- Assumptions
- Errors (Residuals) are normally distributed
- Variance is the same across all scores (Homoscedasticity)
- Relationship is linear
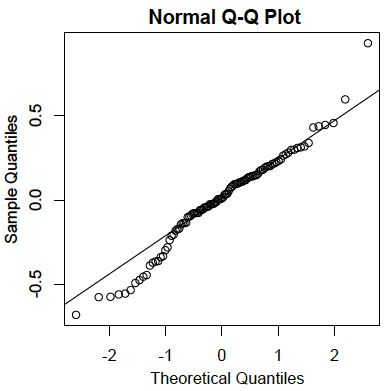
Residuals are normally distributed。
- The residuals are the errors of prediction
- They are the differences between the actual scores on the criterion and the predicted scores
- The plot below reveals that the actual data values at the lower end of the distribution do not increase as much as would be expected for a normal distribution
- It also reveals that the highest value in the data is higher than would be expected for the highest value in a sample of this size from a normal distribution
- Nonetheless, the distribution does not deviate greatly from normality
Homoscedasticity。
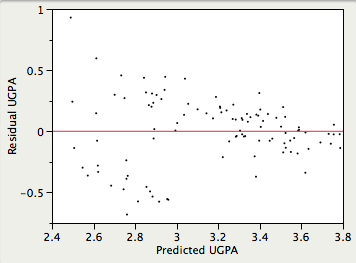
- It is assumed that the variances of the errors of prediction are the same for all predicted values
- Violation Example
- The errors of prediction are much larger for observations with low-to-medium predicted scores than for observations with high predicted scores
- A confidence interval on a low predicted UGPA would underestimate the uncertainty
Linearity。
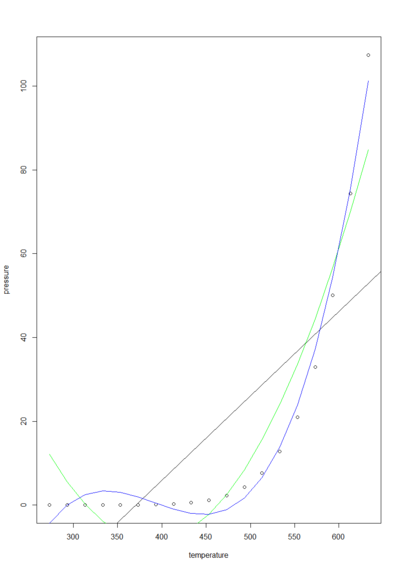
- It is assumed that the relationship between each predictor variable and the criterion variable is linear
- Violation consequences
- The predictions may systematically overestimate the actual values for one range of values on a predictor variable
- They may underestimate them for another range
Relationships between predictor variables。
- Ideally, predictor variables would be independent but it is hardly ever the case
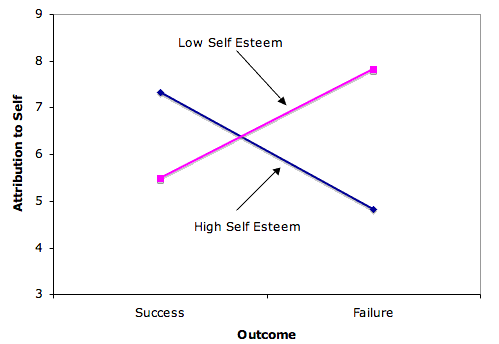
Interaction
- Two independent variables interact if the effect of one of the variables differs depending on the level of the other variable
- Adding sugar and stirring the coffee (Criterion: sweetness of the coffee)
- Adding carbon to steel and quenching (Criterion: strength of the material)
- The IQ of a person and their knowledge/education (Criterion: solving a specific problem)
- Advertising spending and advertisement design (Criterion: revenue from sales)
Quiz。
Quiz
