Statistics for Decision Makers - 14.04 - Regression - Inferential Statistics
Jump to navigation
Jump to search
<slideshow style="nobleprog" headingmark="。" incmark="…" scaled="false" font="Trebuchet MS" footer="www.NobleProg.co.uk" subfooter="Training Courses Worldwide">
- title
- 14.04 - Regression - Inferential Statistics
- author
- Bernard Szlachta (NobleProg Ltd) bs@nobleprog.co.uk
</slideshow>
Assumptions。
- No assumptions are needed to determine the best-fitting straight line
- Assumptions are made in the calculation of inferential statistics
- These assumptions refer to the population, not the sample
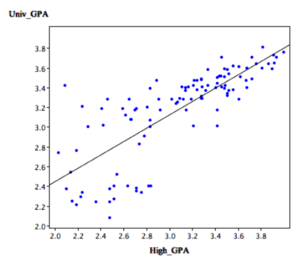
- Linearity
- The relationship between the two variables is linear
- Homoscedasticity
- The variance around the regression line is the same for all values of X
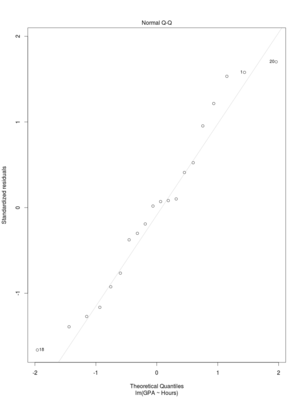
- The errors of prediction are distributed normally
- This means that the deviations from the regression line are normally distributed. It does not mean that X or Y is normally distributed.
Significance Test for the Slope (b)。
Coefficients:
            Estimate Std. Error  Pr(>|t|)
(Intercept)  1.63968    0.45150 0.00191
Hours        0.05223    0.02108  0.02334
Residual standard error: 0.6449 on 18 degrees of freedom
Multiple R-squared:  0.2544,    Adjusted R-squared:  0.213
F-statistic: 6.142 on 1 and 18 DF,  p-value: 0.02334
- The 0.02108 statistic is the sample value of the slope (b) and the hypothesized value is 0
- The P value is 0.02335 < 0.05
- Therefore, the slope is significantly different from 0
Significance Test for the Correlation。
Coefficients:
            Estimate Std. Error  Pr(>|t|)
(Intercept)  1.63968    0.45150 0.00191
Hours        0.05223    0.02108  0.02334
Residual standard error: 0.6449 on 18 degrees of freedom
Multiple R-squared:  0.2544,    Adjusted R-squared:  0.213
F-statistic: 6.142 on 1 and 18 DF,  p-value: 0.02334
- The P-value < 0.05 therefore the correlation is significant
- If the correlation is not significant, the model is not valid
Quiz。
Quiz


