Statistics for Decision Makers - 14.01 - Regression
<slideshow style="nobleprog" headingmark="。" incmark="…" scaled="false" font="Trebuchet MS" footer="www.NobleProg.co.uk" subfooter="Training Courses Worldwide">
- title
- 14.01 - Regression
- author
- Bernard Szlachta (NobleProg Ltd) bs@nobleprog.co.uk
</slideshow>
Simple Regression。
- Simple linear regression
- Predicts scores on one variable from the scores on a second variable
- Criterion variable
- The variable we are predicting, referred to as Y
- Predictor variable
- The variable we are basing our predictions on, referred to as X
- When there is only one predictor variable, the prediction method is called simple regression
- In simple linear regression, the predictions of Y when plotted as a function of X form a straight line
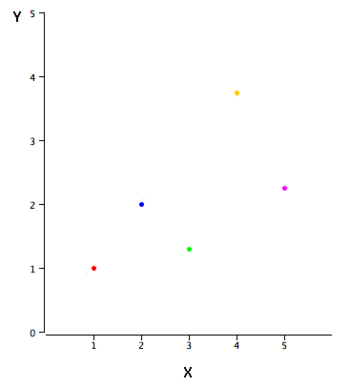
Simple Regression Example。

|
X | Y |
|---|---|---|
| 1.00 | 1.00 | |
| 2.00 | 2.00 | |
| 3.00 | 1.30 | |
| 4.00 | 3.75 | |
| 5.00 | 2.25 |
- There is a positive relationship between X and Y
- We want to predict Y from X
- The higher the value of X, the higher your prediction of Y
Linear regression。
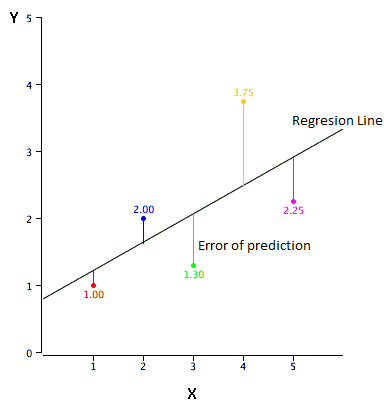
- Linear regression consists of finding the best-fitting straight line through the points
- The best-fitting line is called a regression line
The error of prediction。
The error of prediction for a point is the value of the point minus the predicted value (the value on the line)
- Example
| X | Y | Y' | Y-Y' | (Y-Y')2 |
|---|---|---|---|---|
| 1.00 | 1.00 | 1.210 | -0.210 | 0.044 |
| 2.00 | 2.00 | 1.635 | 0.365 | 0.133 |
| 3.00 | 1.30 | 2.060 | -0.760 | 0.578 |
| 4.00 | 3.75 | 2.485 | 1.265 | 1.600 |
| 5.00 | 2.25 | 2.910 | -0.660 | 0.436 |
- The predicted values (Y') and the errors of prediction (Y-Y')
- The first point has a Y of 1.00 and a predicted Y of 1.21. Therefore its error of prediction is -0.21.
Regression Line
The Best Fitting Line。
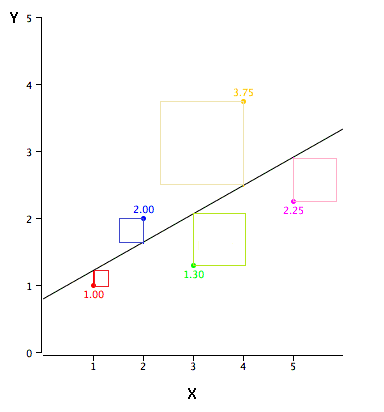
- The best fitting line is usually the line that minimizes the sum of the squared errors of prediction
- The last column in the previous table shows the squared errors of prediction
- The sum of the squared errors of prediction shown in the previous table is lower than it would be for any other regression line
- This method is called Ordinary Least Squares [OLS]
The Formula for a Regression Line。
The formula for a regression line
Y' = bX + A
where Y' : predicted score, b  : slope of the line, A  : Y intercept
- Example
The equation for the line in the previous graph is
Y' = 0.425X + 0.785
- For X = 1, Y' = (0.425)(1) + 0.785 = 1.21
- For X = 2, Y' = (0.425)(2) + 0.785 = 1.64
The Slope of the Regression Line。
The slope (b) can be calculated as follows:
b = r sY/sX
The intercept (A) can be calculated as
A = MY - bMX
For these data,
b = (0.627)(1.072)/1.581 = 0.425
A = 2.06 - (0.425)(3)=0.785
Example。
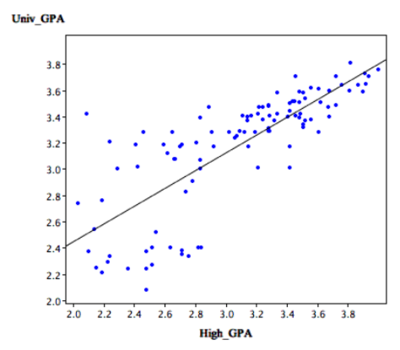
How could we predict a student's university GPA if we knew his or her high school GPA?
- The correlation is 0.78
The regression equation is
GPA' = (0.675)(High School GPA) + 1.097
A student with a high school GPA of 3 would be predicted to have a university GPA of
GPA' = (0.675)(3) + 1.097 = 3.12
The graph shows that here is a strong positive relationship between University GPA and High School GPA
Assumptions。
- It may surprise you, but the calculations shown in this section are assumption free
- If the relationship between X and Y is not linear, a different shaped function could fit the data better
- Inferential statistics in regression are based on several assumptions
Quiz。
Quiz


