Statistics for Decision Makers - 07.01 - Normal Distributions
Jump to navigation
Jump to search
<slideshow style="nobleprog" headingmark="。" incmark="…" scaled="false" font="Trebuchet MS" footer="www.NobleProg.co.uk" subfooter="Training Courses Worldwide" >
- title
- 07.01 - Normal Distributions
- author
- Bernard Szlachta (NobleProg Ltd) bs@nobleprog.co.uk
</slideshow>
Normal Distributions。
- Most of the statistical analyses presented are based on the bell-shaped or normal distribution
- We learn how to calculate probabilities based on the normal distribution
- A frequently used normal distribution is called the Standard Normal distribution (AKA Gauss Distribution)
- The binomial distribution can be approximated by a normal distribution
- A binomial distribution is used for discrete variables
- A normal distribution is for continuous variables
Bell Curve。
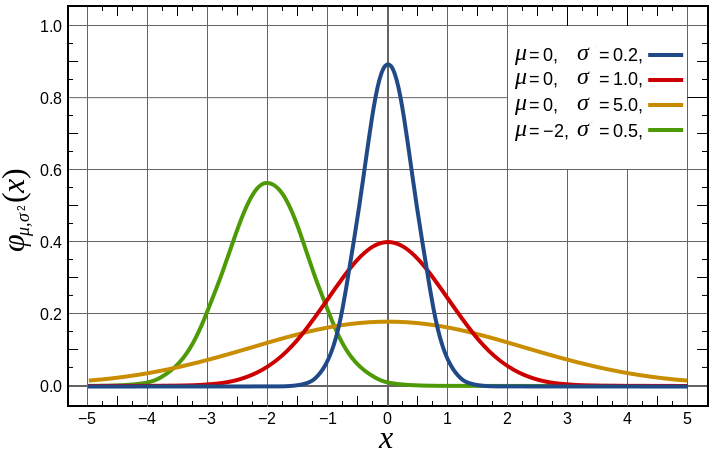
- "Gaussian curve" (μ = 0, σ = 1)
- Although Gauss played an important role in its history, de Movire first discovered the normal distribution
- There is no single "the normal distribution" since there are many normal distributions which differ in their means and standard deviations
- Normal distributions can differ in their means and in their standard deviations
- The distributions below, as well as all other normal distributions, are symmetric with relatively more values at the centre of the distribution and relatively few in the tails
=NORMDIST(1,0,1,FALSE) = 0.2419707245
The density of the normal distribution。
- The density of the normal distribution (the height for a given value on the x axis) is shown above
- The parameters μ and σ are the mean and standard deviation, respectively, and define the normal distribution
- The symbol e is the base of the natural logarithm and π is the constant pi
- Since this is a non-mathematical treatment of statistics, do not worry if this expression confuses you
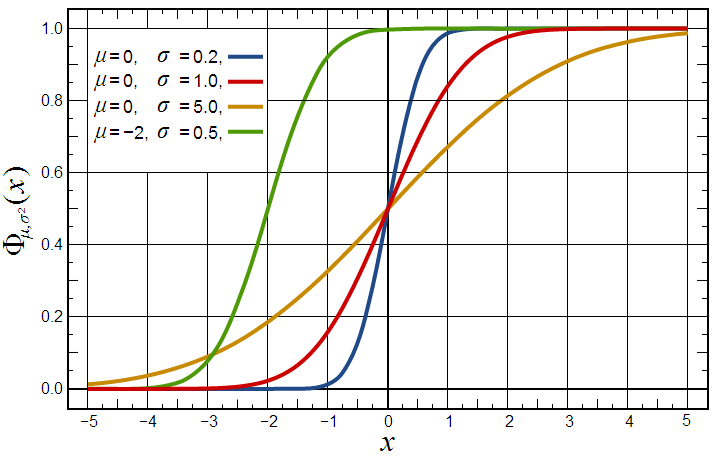
Normal Cumulative Distribution。
=NORMDIST(1,0,1,true) = 0.8413447461
Features of Normal Distributions。
- Normal distributions are symmetric around their mean
- The mean, median, and mode of a normal distribution are equal
- The area under the normal curve is equal to 1.0
- Normal distributions are denser in the center and less dense in the tails
- Normal distributions are defined by two parameters, the mean (μ) and the standard deviation (σ)
- 68% of the area of a normal distribution is within one standard deviation of the mean
- Approximately 95% of the area of a normal distribution is within two standard deviations of the mean
Quiz。
Quiz


