Statistics for Decision Makers - 05.04 - Probability - Binomial Distribution
<slideshow style="nobleprog" headingmark="。" incmark="…" scaled="false" font="Trebuchet MS" footer="www.NobleProg.co.uk" subfooter="Training Courses Worldwide">
- title
- 05.04 - Probability - Binomial Distribution
- author
- Bernard Szlachta (NobleProg Ltd) bs@nobleprog.co.uk
</slideshow>
Probability Distribution。
When you flip a coin, there are two possible outcomes: heads and tails.
- Each outcome has a fixed probability, the same from trial to trial.
- In the case of coins, heads and tails each have the same probability of 1/2.
- Binomial Distributions
- Probability distributions for which there are just two possible outcomes with fixed probabilities summing to one.
Example。
| Outcome | First Flip | Second Flip |
|---|---|---|
| 1 | Heads | Heads |
| 2 | Heads | Tails |
| 3 | Tails | Heads |
| 4 | Tails | Tails |
- The possible outcomes that could occur if you flipped a coin twice
- Note that the four outcomes are equally likely: each has probability 1/4
- To see this, note that the tosses of the coin are independent (neither affects the other)
- Hence, the probability of a head on Flip 1 and a head on Flip 2 is the product of P(H) and P(H), which is 1/2 x 1/2 = 1/4
- The same calculation applies to the probability of a head on Flip 1 and a tail on Flip 2
- Each is 1/2 x 1/2 = 1/4.
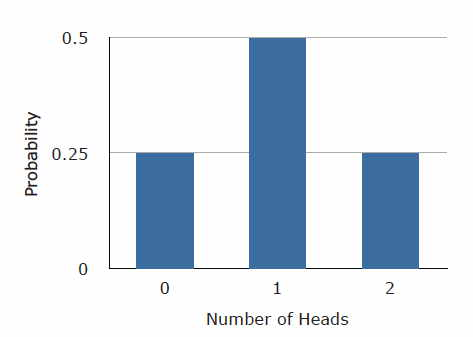
Example。

|
Number of Heads | Probability |
|---|---|---|
| 0 | 1/4 | |
| 1 | 1/2 | |
| 2 | 1/4 |
The figure above is a discrete probability distribution
- It shows the probability for each of the values on the X-axis
- Defining a head as a "success," the figure shows the probability of 0, 1, and 2 successes for two trials (flips) for an event that has a probability of 0.5 of being a success on each trial
- This makes it an example of a binomial distribution
The Formula for Binomial Probabilities。
The binomial distribution consists of the probabilities of each of the possible numbers of successes on N trials for independent events that each have a probability of π (the Greek letter pi) of occurring.
- For the coin flip example, N = 2 and π = 0.5
- The formula for the binomial distribution
 where P(x) is the probability of x successes out of N trials,
N is the number of trials, and
π is the probability of success on a given trial.
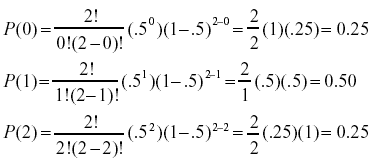
Formula Example。
Applying this to the coin flip example,
In a spreadsheet
=BINOMDIST(0,2,0.5,false)
Example。
- If you flip a coin twice, what is the probability of getting one or more heads?
- Since the probability of getting exactly one head is 0.50 and
- the probability of getting exactly two heads is 0.25,
- the probability of getting one or more heads is 0.50 + 0.25 = 0.75.
In a spreadsheet
=BINOMDIST(1,2,0.5,0) + BINOMDIST(2,2,0.5,0)
Cumulative Probabilities。
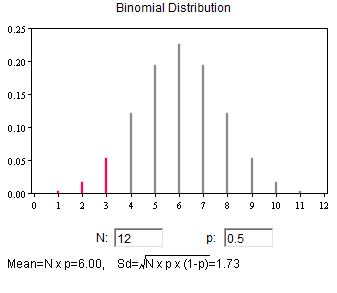
We toss a coin 12 times. What is the probability that we get between 0 and 3 heads?
- The answer is found by computing the probability of exactly 0 heads, exactly 1 head, exactly 2 heads, and exactly 3 heads
- The probability of getting between 0 and 3 heads is then the sum of these probabilities
- The probabilities are: 0.0002, 0.0029, 0.0161, and 0.0537
- The sum of the probabilities is 0.073
In a spreadsheet
=BINOMDIST(3,12,0.5,1)
Mean and Standard Deviation of Binomial Distributions。
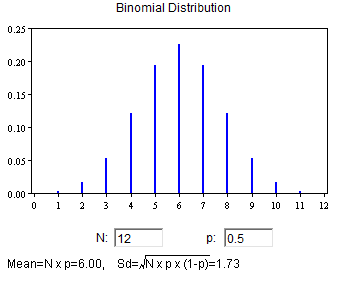
plot(0:12,dbinom(0:12,12,0.5))Consider a coin-tossing experiment in which you tossed a coin 12 times and recorded the number of heads. If you performed this experiment over and over again, what would the mean number of heads be?
- On average, you would expect half the coin tosses to come up heads.
- Therefore the mean number of heads would be 6.
Mean and Standard Deviation of Binomial Distributions。
In general, the mean of a binomial distribution with parameters N (the number of trials) and π (the probability of success on each trial) is:
μ = Nπ
where μ is the mean of the binomial distribution
The variance of the binomial distribution is:
σ2 = Nπ(1-π)
where σ2 is the variance of the binomial distribution
Example。
Let's return to the coin-tossing experiment.
- The coin was tossed 12 times, so N = 12
- A coin has a probability of 0.5 of coming up heads
- Therefore, π = 0.5
The mean and variance can therefore be computed as follows:
μ = Nπ = (12)(0.5) = 6
σ2 = Nπ(1-π) = (12)(0.5)(1.0 - 0.5) = 3.0
Naturally, the standard deviation (σ) is the square root of the variance (σ2)

Quiz。
Quiz


