Statistics for Decision Makers - 04.02 - Pearson Correlation
Jump to navigation
Jump to search
<slideshow style="nobleprog" headingmark="。" incmark="…" scaled="false" font="Trebuchet MS" footer="www.NobleProg.co.uk" subfooter="Training Courses Worldwide">
- title
- 04.02 - Pearson Correlation
- author
- Bernard Szlachta (NobleProg Ltd) bs@nobleprog.co.uk
</slideshow>
Pearson's correlation。
- Pearson product-moment correlation coefficient
- A measure of the strength of the linear relationship between two variables.
- Other names
- Pearson's correlation
- Correlation coefficient
- If the relationship between the variables is not linear, then the correlation coefficient does not adequately represent the strength of the relationship between the variables
- Symbols for Pearson's correlation
- "ρ" in the population
- "r" when it is measured in a sample
Pearson's r 。
Pearson's r can range from -1 to 1.
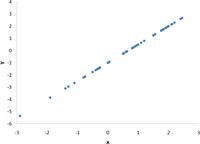
- r = 1 indicates a perfect positive linear relationship between variables
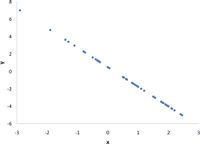
- r = -1 indicates a perfect negative linear relationship between variables
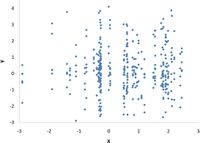
- r = 0 indicates no linear relationship between variables
| r = 1 | r = -1 | r = 0 |
| perfect positive linear relationship | A perfect negative linear relationship | No relationship |
|
|
|
-1<r<1 。
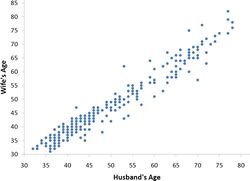
With real data, you would not expect to get values of r of exactly -1, 0, or 1.
| r = 0.97 | r = 0.63 |
|
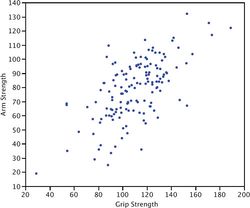
|
Symmetry。
Pearson's correlation is symmetric.
- The correlation of X with Y is the same as the correlation of Y with X
- For example, the correlation of weight with height is the same as the correlation of height with weight
Linear transformations。
- Pearson's r is is unaffected by linear transformations.
This means that multiplying a variable by a constant and/or adding a constant does not change the correlation of that variable with other variables.
- For instance, the correlation of weight and height does not depend on whether height is measured in inches, feet, or even miles
- Similarly, adding five points to every student's test score would not change the correlation of the test score with other variables such as GPA
Quiz。
Quiz

