Statistics for Decision Makers - 03.03 - Summarizing Distributions - Variability
Jump to navigation
Jump to search
<slideshow style="nobleprog" headingmark="。" incmark="…" scaled="false" font="Trebuchet MS" footer="www.NobleProg.co.uk" subfooter="Training Courses Worldwide">
- title
- 03.03 - Summarizing Distributions - Variability
- author
- Bernard Szlachta (NobleProg Ltd) bs@nobleprog.co.uk
</slideshow>
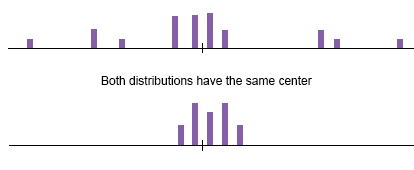
Average is not enough。
If your head is in the freezer and your feet are in the oven, on average you're comfortable.
What is Variability?。
Variability refers to
- How much the numbers in a distribution differ from each other
- How "spread out" a group of scores is
The terms variability, spread, and dispersion are synonyms, and refer to how spread out a distribution is.
Quiz Example。
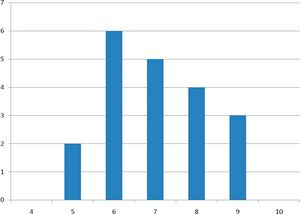
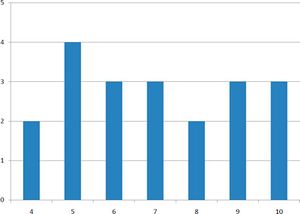
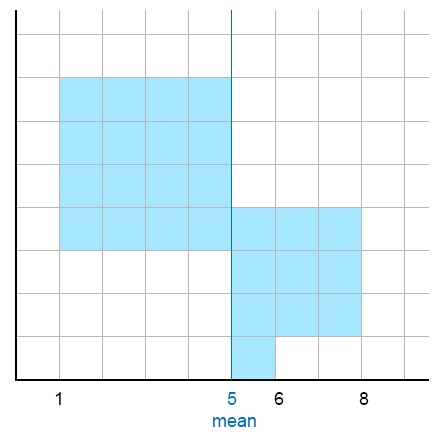
- The graphs above represent the scores on two quizzes
- The mean score for each quiz is 7.0
- The distributions are quite different
- The scores on Quiz 1 are more densely packed and those on Quiz 2 are more spread out
- The differences among students were much greater on Quiz 2 than on Quiz 1
Measures of Variability。
- Range
- Interquartile range
- Variance
- Standard deviation
Range。
The range is the highest score minus the lowest score (max - min).
- Example
- 10, 2, 5, 6, 7, 3, 4
- The highest number is 10, and the lowest number is 2, so 10 - 2 = 8
- The range is 8
Quiz Example。
Consider the two quizzes shown in the graphs above.
- On Quiz 1, the lowest score is 5 and the highest score is 9; the range is 4
- On Quiz 2, the range is 6
The range on Quiz 2 was larger.
Interquartile Range。
- The interquartile range (IQR) is the range of the middle 50% of the scores in a distribution
- It is computed as follows:
IQR = 75th percentile - 25th percentile
Quiz Example
- For Quiz 1, the 75th percentile is 8 and the 25th percentile is 6; the interquartile range is 2
- For Quiz 2, which has a greater spread, the 75th percentile is 9, the 25th percentile is 5; the interquartile range is 4
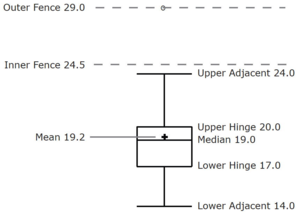
- In box plots, the 75th percentile was called the upper hinge and the 25th percentile was called the lower hinge
- Using this terminology, the interquartile range is referred to as the H-spread
Semi-interquartile range。
- The semi-interquartile range is defined simply as the interquartile range divided by 2
- If a distribution is symmetric, the median plus or minus the semi-interquartile range contains half the scores in the distribution
Variance。
- Variability can also be defined in terms of how close the scores in the distribution are to the middle of the distribution.
- Variance is the average squared difference of the scores from the mean
- Population Variance Formula
Quiz Example。
The data from Quiz 1 are shown below.
Scores	 Deviation from Mean   Squared Deviation
X         X - μ                (X - μ)2
9  	  2	               4
9	  2	               4
9	  2                    4
8	  1	 	       1
8	  1		       1
8	  1		       1
8	  1	               1
7  	  0	               0
7	  0		       0
7	  0		       0
7	  0		       0
7	  0		       0
6	 -1	 	       1
6	 -1	 	       1
6	 -1	 	       1
6	 -1	 	       1
6	 -1	 	       1
5	 -2	 	       4
5	 -2	 	       4

μ   The mean of deviations    The mean of squared deviations
7	 0	              1.5
- The mean score is 7.0
- The column "Deviation from Mean" contains the score minus 7
- The column "Squared Deviation" is simply the previous column squared
- The mean of the squared deviations is 1.5 (the variance)
- Analogous calculations with Quiz 2 show that its variance is 6.7
Sample Variance。
- If the variance in a sample is used to estimate the variance in a population, then the formula for Population Variance underestimates the variance and the following formula should be used.
- Where s2 is the estimate of the variance and M is the sample mean.
- Note that M is the mean of a sample taken from a population with a mean of μ.
- In practice, the variance is usually computed in a sample, this formula is most often used.
- Example
- Assume the scores 1, 2, 4, 5 were sampled from a larger population.
- To estimate the variance in the population you would compute s2 as follows:
 M = (1 + 2 + 4 + 5)/4 = 12/4 = 3
 s2 = [(1-3)2 + (2-3)2 + (4-3)2 + (5-3)2]/(4-1)
    = (4 + 1 + 1 + 4)/3 = 10/3 = 3.333
Standard Deviation。
- The standard deviation is the square root of the variance.
Quiz Example
The standard deviations of the two quiz distributions are 1.225 and 2.588.
Standard Deviation and Normal Distribution。
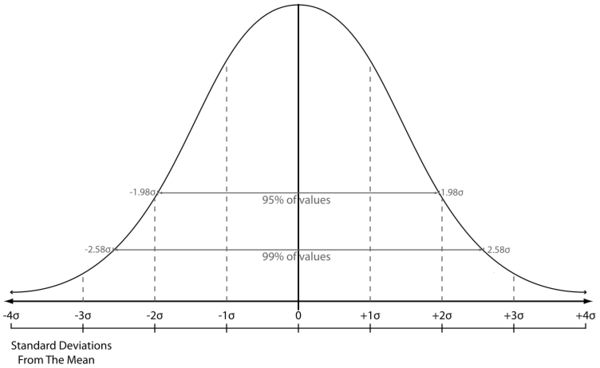
- 68% of the distribution is within one standard deviation of the mean
- 95% of the distribution is within two standard deviations of the mean
- Population standard deviation is σ
- An estimate computed in a sample is s
Clothes Manufacturer Example。
- You are a clothes producer
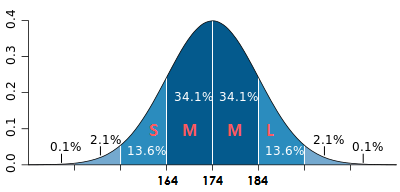
- If you had a market of people with a mean height of 174 and a standard deviation of 10, then 68% of the clients would be between 164 and 184
- You expect to sell 1000 pieces of clothing, i.e. 680 of the pieces of clothing you produce should be size M
- The number of people who could buy size S is 0.136 * 1000 = 136, the same for L
- How many pieces of clothing do you need to produce of sizes XL and XXL?
More Examples。
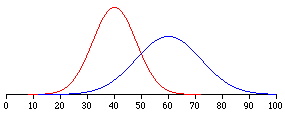
The figure above shows two normal distributions.
- The red distribution has a mean of 40 and a standard deviation of 5
- The blue distribution has a mean of 60 and a standard deviation of 10
- For the red distribution, 68% of the distribution is between 35 and 45
- For the blue distribution, 68% is between 50 and 70
Interpretation of Units。
- If we measure height in metres
- the standard deviation units would be metres
- the variance unit would be metres squared
- For decision making, standard deviation is better
- For mathematicians, variance is better as it can be easily added to another variance
Finance。
- Standard deviation is often used as a measure of the risk associated with price-fluctuations of a given asset (stocks, bonds, property, etc.)
- It gives investors a mathematical basis for investment decisions (known as mean-variance optimization)
- If the risk increases, the expected return on an investment should increase as well (risk premium)
- Standard deviation provides a quantified estimate of the uncertainty of future returns
Manufacturing and Service sectors。
- Standard deviation is a measure of reliability or quality
- In the "six sigma process" if one has six standard deviations between the process mean and the nearest specification limit, practically no items will fail to meet specifications
- In other words there will be no more than 3.4 defective parts per million opportunities (DPMO)
Standard Error。
- Standard error
- Standard error of the sample is an estimate of how far the sample mean is likely to be from the population mean
- Standard deviation of the sample
- The degree to which individuals within the sample differ from the sample mean
Hypothesis Testing。
- 95% and 99% confidence or correspondingly 5% and 1% significance level are derived from the fact that errors should be normally distributed
- So 5% alpha corresponds to 3 sigma, where 1% corresponds to 4 sigma
Quiz。
Quiz
