Statistics for Decision Makers - 03.02 - Summarizing Distributions - Central Tendency
<slideshow style="nobleprog" headingmark="。" incmark="…" scaled="false" font="Trebuchet MS" footer="www.NobleProg.co.uk" subfooter="Training Courses Worldwide">
- title
- 03.02 - Summarizing Distributions - Central Tendency
- author
- Bernard Szlachta (NobleProg Ltd) bs@nobleprog.co.uk
</slideshow>
Central Tendency。
- A mathematician, a physicist and a statistician went hunting for deer.
- The mathematician fired first, missing the buck's nose by a few inches.
- The physicist fired second and missed the tail by a wee bit.
- The statistician started jumping up and down saying:
- "We got him! We got him!"
Politician understand statistics。
- "Every American should have above average income, and my Administration is going to see they get it."
(Bill Clinton on campaign trail)
Central Tendency。
- mean
- arithmetic
- geometric
- median
- mode
Average can refer to any of the measures above.
Arithmetic Mean。
The symbol "μ" is used for the mean of a population.
 μ = ΣX/N
where ΣX is the sum of all the numbers in the population and
N is the number of numbers in the population.
The symbol "M" is used for the mean of a sample.
M = ΣX/N
where ΣX is the sum of all the numbers in the sample and
N is the number of numbers in the sample.
Median。
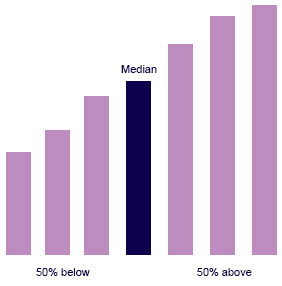
- The Median is
- The 50th percentile
- The midpoint of a distribution: the same number of scores is above the median as below it
- Computation of the Median
- Odd number of numbers: the median is simply the middle number (the median of 2, 4, 7 is 4)
- Even number of numbers: the median is the mean of the two middle numbers. (the median of 2, 4, 7, 12 is (4+7)/2 = 5.5)
Mode。
- The mode is the most frequently occurring value.
- The mode of continuous data is normally computed from a grouped frequency distribution (the frequency of each value is one since no two scores will be exactly the same).
- Example
- The table below shows a grouped frequency distribution for the target response time data
- Since the interval with the highest frequency is 600-700, the mode is the middle of that interval (650)
| Range | Frequency | 
|
|---|---|---|
| 500-600 | 3 | |
| 600-700 | 6 | |
| 700-800 | 5 | |
| 800-900 | 5 | |
| 900-1000 | 0 | |
| 1000-1100 | 1 |
Geometric Mean。
- The geometric mean is computed by multiplying all the numbers together and then taking the nth root of the product
- The formula for the geometric mean is:
Example
- For the numbers 1, 10, and 100, the product of all the numbers is: 1 x 10 x 100 = 1,000
- Since there are three numbers, we take the cubed root of the product (1,000) which is equal to 10
(1 x 10 x 100 )1/3 = 10001/3 = 10
The Geometric Mean and Logarithms。
- The geometric mean has a close relationship with logarithms
- The table below shows the logs (base 10) of these three numbers
- The arithmetic mean of the three logs is 1
- The anti-log of this arithmetic mean of 1 is the geometric mean
- The anti-log of 1 is 101 = 10
- The geometric mean only makes sense if all the numbers are positive
| x | Log10(X) |
|---|---|
| 1 | 0 |
| 10 | 1 |
| 100 | 2 |
The geometric mean is an appropriate measure to use for averaging rates.
Example。
Consider a stock portfolio that began with a value of $1,000 and had annual returns of 13%, 22%, 12%, -5%, and -13% (see the table below on the left).
| Year | Return | Value | 
|
Return | Value |
|---|---|---|---|---|---|
| 1 | 13% | 1,130 | 5% | 1,050 | |
| 2 | 22% | 1,379 | 5% | 1,103 | |
| 3 | 12% | 1,544 | 5% | 1,158 | |
| 4 | -5% | 1,467 | 5% | 1,216 | |
| 5 | -13% | 1,276 | 5% | 1,276 |
How to compute the average annual rate of return?
- The answer is to compute the geometric mean of the returns
- Instead of using the percents, each return is represented as a multiplier indicating how much higher the value is after the year
- This multiplier is 1.13 for a 13% return and 0.95 for a 5% loss
- The multipliers for this example are 1.13, 1.22, 1.12, 0.95, and 0.87
- The geometric mean of these multipliers is 1.05
- Therefore, the average annual rate of return is 5%
- The table on the right above shows how a portfolio gaining 5% a year would end up with the same value ($1,276)
Comparing Measures of Central Tendency。
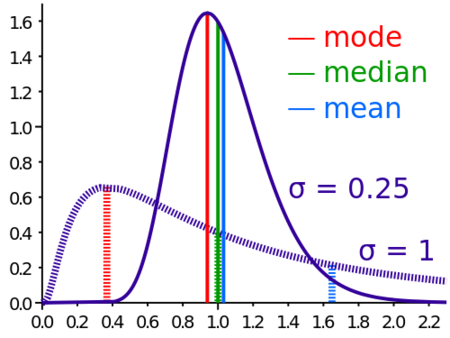
- For symmetric distributions, the mean and the median are equal, as is the mode except in bimodal distributions
- Differences among the measures occur with skewed distributions
Example 1。
|
Measure | Value |
|---|---|---|
| Mode | 84.00 | |
| Median | 90.00 | |
| Geometric Mean | 89.70 | |
| Mean | 91.58 |
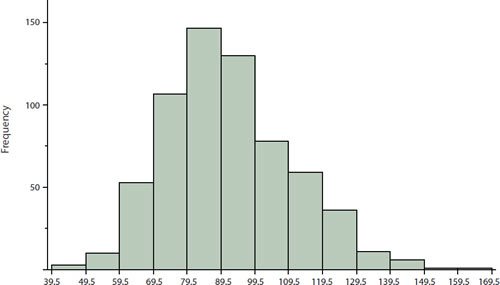
The figure above shows the distribution of 642 scores on an introductory psychology test.
- Notice this distribution has a slight positive skew
Measures of central tendency are shown in the table .
- Notice they do not differ greatly, with the exception of the mode being considerably lower than the other measures
- When distributions have a positive skew, the mean is typically higher than the median, although it may not be in bimodal distributions
- For these data, the mean of 91.58 is higher than the median of 90
- The geometric mean is lower than all measures except the mode
Example 2。
|
Measure | Value |
|---|---|---|
| Mode | 250 | |
| Median | 500 | |
| Geometric Mean | 555 | |
| Trimean | 792 | |
| Mean trimmed 50% | 619 | |
| Mean | 1,183 |
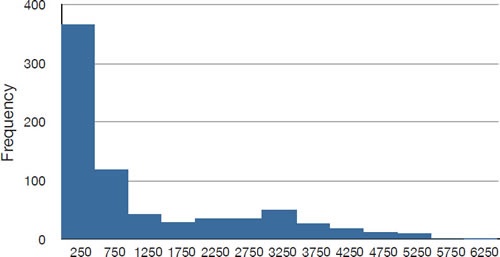
- The distribution of baseball salaries shown in the figure has a much more pronounced skew than the distribution in Example 1
- The large skew results in very different values for these measures
- No single measure of central tendency is sufficient for data such as these
- If you were asked the very general question: "So, what do baseball players make?" and answered with the mean of $1,183,000, you would not have told the whole story since only about one third of baseball players make that much
- If you answered with the mode of $250,000 or the median of $500,000, you would not be giving any indication that some players make many millions of dollars
- Fortunately, there is no need to summarize a distribution with a single number
- What would you do if you want to track changes in salaries over the last 10 years in a single graph?
Example 3。
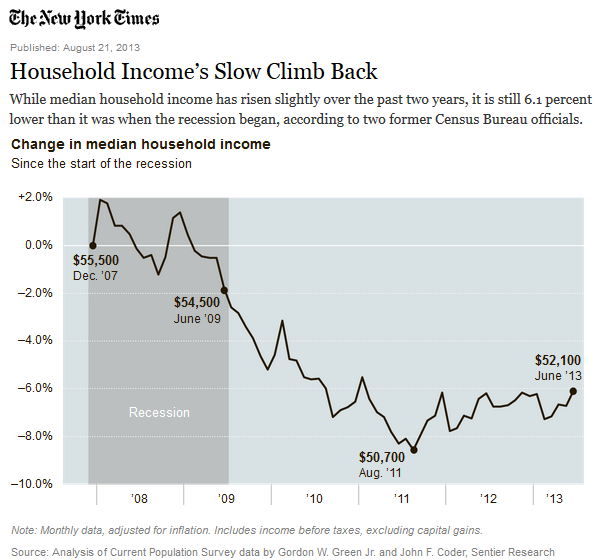
- In the media, the median is usually reported to summarize the center of skewed distributions
- E.g. median salaries and median prices of houses sold, etc
- This is better than reporting only the mean, but it would be informative to hear more statistics
Central Tendency is not enough。
A statistician confidently tried to cross a river that was 1 meter deep on average.
Quiz。
Quiz
