Statistics for Decision Makers - 03.01 - Summarizing Distributions
Jump to navigation
Jump to search
<slideshow style="nobleprog" headingmark="。" incmark="…" scaled="false" font="Trebuchet MS" footer="www.NobleProg.co.uk" subfooter="Training Courses Worldwide">
- title
- 03.01 - Summarizing Distributions
- author
- Bernard Szlachta (NobleProg Ltd) bs@nobleprog.co.uk
</slideshow>
Describing Data。
"If you torture data enough it will confess"
Tools。
- Central Tendency (mean, median, etc...)
- Variability (standard deviation, etc...)
- Distribution (histograms, probability density, etc...)
Use Cases。
- Describing one or more datasets that are too big to analyse item by item
- Using fewer numbers or shapes to compare datasets (without probability)
What is Descriptive Statistics?。
- Descriptive statistics: a few numbers summarize a bigger set
- One important aspect of a distribution is where its centre is located
- How is a distribution spread out? (In other words, how much do the numbers in the distribution vary from one another?)
- Distributions can differ in shape
Descriptive Statistics and IT。
- Business Intelligence
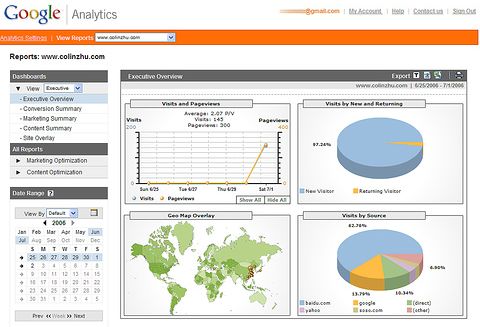
- Dashboards
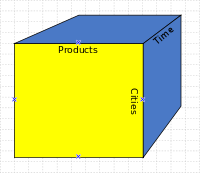
- OLAP


