Standard Error of the Estimate
Jump to navigation
Jump to search
The standard error of the estimate
The standard error of the estimate
- is closely related to this quantity and is defined below:
- is a measure of the accuracy of predictions
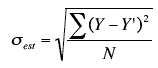 sest is the standard error of the estimate,
Y - actual score
Y' - predicted score
Y-Y' - differences between the actual scores and the predicted scores.
Σ(Y-Y')2 - SSE
N - number of pairs of scores
sest is the standard error of the estimate,
Y        - actual score
Y'       - predicted score
Y-Y'     - differences between the actual scores and the predicted scores.
Σ(Y-Y')2 - SSE
N        - number of pairs of scores

Simple Example
- The graphs below shows two regression examples.
- You can see that in graph A, the points are closer to the line then they are in graph B.
- Therefore, the predictions in Graph A are more accurate than in Graph B.

Example
Assume the data below are the data from a population of five X-Y pairs

- The last column shows that the sum of the squared errors of prediction is 2.791.
- Therefore, the standard error of the estimate is:

Formula for the Standard Error
There is a version of the formula for the standard error in terms of Pearson's correlation:

where ρ is the population value of Pearson's correlation
SSY is
Similar formulas are used when the standard error of the estimate is computed from a sample rather than a population.
- The only difference is that the denominator is N-2 rather than N, since two parameters (the slope and the intercept) were estimated in order to estimate the sum of squares
- Formulas comparable to the ones for the population are shown below.

Example
For the example data,
- μy = 2.06
- SSY = 4.597
- ρ= 0.6268.
Therefore,

which is the same value computed previously.
Quiz