Regression Toward the Mean
Regression Toward the Mean Example
- Regression toward the mean involves outcomes that are at least partly due to chance.
We begin with an example of a task that is entirely chance: Imagine an experiment in which a group of 25 people each predicted the outcomes of flips of a fair coin.
- For each subject in the experiment, a coin is flipped 12 times and the subject predicts the outcome of each flip.
- The graph below shows the results of a simulation of this "experiment."
- Although most subjects were correct from 5 to 8 times out of 12, one simulated subject was correct 10 times.
- Clearly, this subject was very lucky and probably would not do as well if he or she performed the task a second time.
- In fact, the best prediction of the number of times this subject would be correct on the retest is 6, since the probability of being correct on a given trial is 0.5 and there are 12 trials.

Regression Toward the Mean Example
- More technically, the best prediction for the subject's result on the retest is the mean of the binomial distribution with N = 12 and p = 0.50.
- This distribution is shown below and has a mean of 6.
- The point here is that no matter how many coin flips a subject predicted correctly, the best prediction of their score on a retest is 6.

Regression Toward the Mean
Now we consider a test we will call "Test A" that is partly chance and partly skill: Instead of predicting the outcomes of 12 coin flips, each subject predicts the outcomes of 6 coin flips and answers 6 true/false questions about world history.
- Assume that the mean score on the 6 history questions is 4.
- A subject's score on Test A has a large chance component but also depends on history knowledge.
- If a subject scored very high on this test (such as a score of 10/12), it is likely that they did well on both the history questions and the coin flips.
- If this subject is then given a second test (Test B) that also included coin predictions and history questions, their knowledge of history would be helpful and they would again be expected to score above the mean.
- However, since their high performance on the coin portion of Test A would not be predictive of their coin performance on Test B, they would not be expected to fare as well on Test B as on Test A.
- Therefore, the best prediction of their score on Test B would be somewhere between their score on Test A and the mean of Test B.
- This tendency of subjects with high values on a measure that includes chance and skill to score closer to the mean on a retest is called "regression toward the mean."
The essence of the Regression Toward the Mean
The essence of the regression-toward-the-mean phenomenon is that people with high scores tend to be above average in skill and in luck and that only the skill portion is relevant to future performance.
- Similarly, people with low scores tend to be below average in skill and luck, and their bad luck is not relevant to future performance.
- This does not mean that all people who score high have above average luck.
- However, on average they do.
Regression Toward the Mean Example
Almost every measure of behavior has a chance and a skill component to it.
- Take a student's grade on a final exam as an example.
- Certainly, the student's knowledge of the subject will be a major determinant of his or her grade.
- However, there are aspects of performance that are due to chance.
- The exam cannot cover everything in the course and therefore must represent a subset of the material.
- Maybe the student was lucky in that the one aspect of the course the student did not understand well was not well-represented on the test.
- Or, maybe the student was not sure which of two approaches to a problem would be better but, more or less by chance, chose the right one.
- Other chance elements come into play as well.
- Perhaps the student was awakened early in the morning by a random phone call, resulting in fatigue and lower performance.
- And, of course, guessing on multiple choice questions is another source of randomness in test scores.
- There will be regression toward the mean in a test-retest situation whenever there is less than a perfect (r = 1) relationship between the test and the retest.
This follows from the formula for a regression line with standardized variables shown below:
ZY' = (r)(ZX)
- From this equation it is clear that if the absolute value of r is less than 1, then the predicted value of ZY will be closer to 0, the mean for standardized scores, than is ZX.
- Also, note that if the correlation between X and Y is 0, as it would be for a task that is all luck, the predicted standard score for Y is its mean, 0, regardless of the score on X.
Regression Toward the Mean Example
The graph below shows a scatter plot with the regression line predicting the standardized Verbal SAT from the standardized Math SAT. Note that the slope of the line is equal to the correlation of 0.835 between these variables.

- The point represented by a blue diamond has a value of 1.6 on the standardized Math SAT.
- This means that this student scored 1.6 standard deviations above the mean on Math SAT.
- The predicted score is (r)(1.6) = (0.835)(1.6) = 1.34.
- The horizontal line on the graph shows the value of the predicted score.
- The key point is that although this student scored 1.6 standard deviations above the mean on Math SAT, he or she is only predicted to score 1.34 standard deviations above the mean on Verbal SAT.
- Thus, the prediction is that the Verbal SAT score will be closer to the mean of 0 than is the Math SAT score.
- Similarly, a student scoring far below the mean on Math SAT will be predicted to score higher on Verbal SAT.
- Regression toward the mean occurs in any situation in which observations are selected on the basis of performance on a task that has a random component.
- If you choose people on the basis of their performance on such a task, you will be choosing people partly on the basis of their skill and partly on the basis of their luck on the task.
- Since their luck cannot be expected to be maintained from trial to trial, the best prediction of a person's performance on a second trial will be somewhere between their performance on the first trial and the mean performance on the first trial.
- The degree to which the score is expected to "regress toward the mean" in this manner depends on the relative contributions of chance and skill to the task: the greater the role of chance, the more the regression toward the mean.
Errors Resulting From Failure to Understand Regression Toward the Mean
Failure to appreciate regression toward the mean is common and often leads to incorrect interpretations and conclusions.
- One of the best examples is provided by Nobel Laureate Daniel Kahneman in his autobiography.
- Dr. Kahneman was attempting to teach flight instructors that praise is more effective than punishment.
- He was challenged by one of the instructors who relayed that in his experience praising a cadet for executing a clean maneuver is typically followed by a lesser performance, whereas screaming at a cadet for bad execution is typically followed by improved performance.
- This, of course, is exactly what would be expected based on regression toward the mean.
- A pilot's performance, although based on considerable skill, will vary randomly from maneuver to maneuver.
- When a pilot executes an extremely clean maneuver, it is likely that he or she had a bit of luck in their favor in addition to their considerable skill.
- After the praise but not because of it, the luck component will probably disappear and the performance will be lower.
- Similarly, a poor performance is likely to be partly due to bad luck.
- After the criticism but not because of it, the next performance will likely be better.
- To drive this point home, Kahneman had each instructor perform a task in which a coin was tossed at a target twice.
- He demonstrated that the performance of those who had done the best the first time deteriorated, whereas the performance of those who had done the worst improved.
Example
Regression toward the mean is frequently present in sports performance.
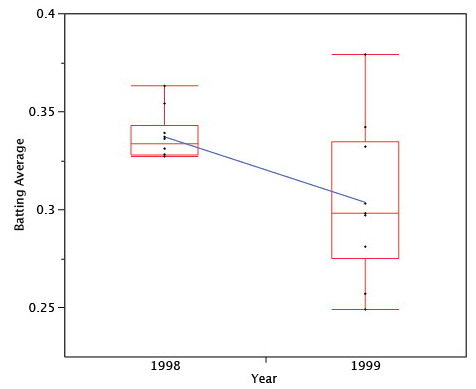
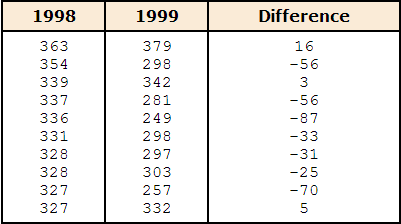
- A good example is provided by Schall and Smith (2000), who analyzed many aspects of baseball statistics including the batting averages of players in 1998.
- They chose the 10 players with the highest batting averages (BAs) in 1998 and checked to see how well they did in 1999.
- According to what would be expected based on regression toward the mean, these players should, on average, have lower batting averages in 1999 than they did in 1998.
- As can be seen in the table below, 7/10 of the players had lower batting averages in 1999 than they did in 1998.
- Moreover, those who had higher averages in 1999 were only slightly higher, whereas those who were lower were much lower.
- The average decrease from 1998 to 1999 was 33 points.
- Even so, most of these players had excellent batting averages in 1999 indicating that skill was an important component of their 1998 averages.
 :
:


- Regression toward the mean plays a role in the so-called "Sophomore Slump," a good example of which is that a player who wins "rookie of the year" typically does less well in his second season.
- A related phenomenon is called the Sports Illustrated Cover Jinx.
Experiment without a control group
An experiment without a control group can confound regression effects with real effects.
- For example, consider a hypothetical experiment to evaluate a reading-improvement program.
- All first graders in a school district were given a reading achievement test and the 50 lowest-scoring readers were enrolled in the program.
- The students were retested following the program and the mean improvement was large.
- Does this necessarily mean the program was effective?
- No, it could be that the initial poor performance of the students was due, in part, to bad luck.
- Their luck would be expected to improve in the retest, which would increase their scores with or without the treatment program.
Experiment without a control group Example
For a real example, consider an experiment that sought to determine whether the drug propranolol would increase the SAT scores of students thought to have test anxiety.
- Propranolol was given to 25 high school students chosen because IQ tests and other academic performance indicated that they had not done as well as expected on the SAT.
- On a retest taken after receiving propranolol, students improved their SAT scores an average of 120 points.
- This was a significantly greater increase than the 38 points expected simply on the basis of having taken the test before.
- The problem with the study is that the method of selecting students likely resulted in a disproportionate number of students who had bad luck when they first took the SAT.
- Consequently, these students would likely have increased their scores on a retest with or without the propranolol.
- This is not to say that propranolol had no effect.
- However, since possible propranolol effects and regression effects were confounded, no firm conclusions should be drawn.
- Randomly assigning students to either the propranolol group or a control group would have improved the experimental design.
- Since the regression effects would then not have been systematically different for the two groups, a significant difference would have provided good evidence for a propranolol effect.