Partitioning the Sums of Squares
One useful aspect of regression is that it can divide the variation in Y into two parts:
- the variation of the predicted scores
- the variation in the errors of prediction
The variation of Y
- the sum of squares Y
- defined as the sum of the squared deviations of Y from the mean of Y
Formula of the Variation of Y
In the population, the formula of The variation of Y
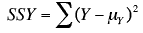 where SSY is the sum of squares Y and
Y is an individual value of Y, and my is the mean of Y
where SSY is the sum of squares Y and
Y is an individual value of Y, and my is the mean of Y
Example
The mean of Y is 2.06 and SSY is the sum of the values in third column and is equal to 4.597

When computed in a sample, you should use the sample mean, M, in place of the population mean.
![]()
Example

- The column Y' were computed according to this equation.
- The column y' contains deviations of Y' from the mean Y'
- The column y'2 is the square of this column.
- The column Y-Y' contains the actual scores (Y) minus the predicted scores (Y')
- The column (Y-Y')2 contains the squares of these errors of prediction
Sum of the squared deviations from the mean
SSY is the sum of the squared deviations from the mean.
- It is therefore the sum of the y2 column and is equal to 4.597.
- SSY can be partitioned into two parts:
- 1. the sum of squares predicted (SSY')
- The sum of squares predicted is the sum of the squared deviations of the predicted scores from the mean predicted score.
- In other words, it is the sum of the y'2 column and is equal to 1.806
- 2.the sum of squares error (SSE)
- The sum of squares error is the sum of the squared errors of prediction.
- It is there fore the sum of the (Y-Y')2 column and is equal to 2.791.
- This can be summed up as:
SSY = SSY' + SSE
4.597 = 1.806 + 2.791
Example

- The sum of y and the sum of y' are both zero
- This will always be the case because these variables were created by subtracting their respective means from each value.
- The mean of Y-Y' is 0
- This indicates that although some Y's are higher than there respective Y's and some are lower, the average difference is zero.
SSY is the total variation
SSY' is the variation explained
SSE is the variation unexplained
Therefore, the proportion of variation explained can be computed as:
Proportion explained = SSY'/SSY
Similarly, the proportion not explained is:
Proportion not explained = SSE/SSY
r2
There is an important relationship between the proportion of variation explained and Pearson's correlation:
- r2 is the proportion of variation explained
Therefore,
- if r = 1, then the proportion of variation explained is 1
- if r = 0, then the proportion explained is 0;
- if r = 0.4, then the proportion of variation explained is 0.16
Since the variance is computed by dividing the variation by N (for a population) or N-1 (for a sample), the relationships spelled out above in terms of variation also hold for variance
Example
- the first term is the variance total
- the second term is the variance of Y'
- the last term is the variance of the errors of prediction (Y-Y')
Similarly, r2 is the proportion of variance explained as well as the proportion of variation explained.
Summary Table
It is often convenient to summarize the partitioning of the data in a table.
- The degrees of freedom column (df) shows the degrees of freedom for each source of variation.
- The degrees of freedom for the sum of squares explained is equal to the number of predictor variables.
- This will always be 1 in simple regression.
- The error degrees of freedom is equal to the total number of observations minus 2.
- In this example, it is 5 - 2 = 3.
- The total degrees of freedom is the total number of observations minus 1.
| Source | Sum of Squares | df | Mean Square |
|---|---|---|---|
| Explained | 1.806 | 1 | 1.806 |
| Error | 2.791 | 3 | 0.930 |
| Total | 4.597 | 4 |
Quiz