Distributions
Jump to navigation
Jump to search
Discrete Variable
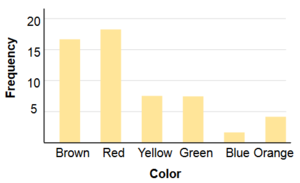
Frequency tables
- containing the number of occurrences in each class of data
- often used to create histograms and frequency polygons
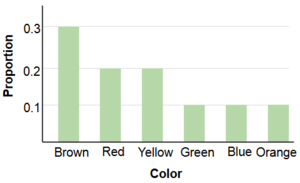
| Colour | Frequency | 
|
|---|---|---|
| Brown | 17 | |
| Yellow | 18 | |
| Red | 7 | |
| Green | 7 | |
| Blue | 2 | |
| Orange | 4 |
Frequency Distribution
- the distribution of empirical data
- consists of a count of the number of occurrences of each value
- For a discrete random variable, a probability distribution contains the probability of each possible outcome
- The sum of all probabilities is always 1.0
| Frequency Distribution | Probability Distribution |
|---|---|
|
|
Continuous Variable Distribution
Problems?
Response time (in millisecond)
568 577 581 640 641 645 657
673 696 703 720 728 729 777
808 824 825 865 875 1007
Grouped Frequency Distribution
- a frequency distribution in which frequencies are displayed for ranges of data rather than for individual values.
- Histogram is a graphical representation of a distribution .
- It partitions the variable on the x-axis into various contiguous class intervals of (usually) equal widths.
- Example
| Range | Frequency | 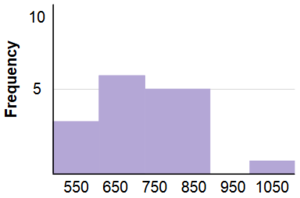
|
|---|---|---|
| 500-600 | 3 | |
| 600-700 | 6 | |
| 700-800 | 5 | |
| 800-900 | 5 | |
| 900-1000 | 0 | |
| 1000-1100 | 1 |
A probability density function
A probability density function is a formula that can be used to compute probabilities of a range of outcomes for a continuous random variable.
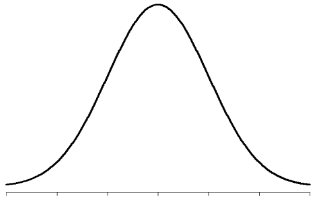
Normal Distribution
- one of the most common continuous distributions
- sometimes referred to as a "bell-shaped distribution.
Skewness
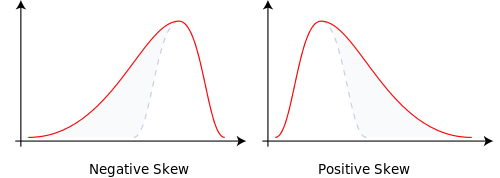
A distribution is skewed if one tail extends out further than the other.
- A distribution has positive skew (is skewed to the right) if the tail to the right is longer
- A distribution has a negative skew (is skewed to the left) if the tail to the left is longer
Kurtosis
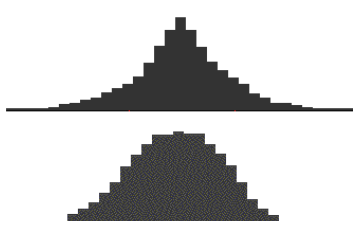
- Leptokurtic is a distribution with long tails relative to a normal distribution
- Platykurtic is a distribution with short tails relative to a normal distribution
Quiz
