Computing Pearson's r
Jump to navigation
Jump to search
- There are several formulas that can be used to compute Pearson's correlation.
- Some formulas make more conceptual sense whereas others are easier to actually compute.
- We are going to begin with a formula that makes more conceptual sense.
X and x
We are going to compute the correlation between the variables X and Y shown in the table below.

- We begin by computing the mean for X and subtracting this mean from all values of X.
- The new variable is called "x."
- The variable "y" is computed similarly.
- The variables x and y are said to be deviation scores because each score is a deviation from the mean.
- Notice that the means of x and y are both 0. Next we create a new column by multiplying x and y.
The sum of the xy
Before proceeding with the calculations, let's consider why the sum of the xy column reveals the relationship between X and Y.
- If there were no relationship between X and Y, then positive values of x would be just as likely to be paired with negative values of y as with positive values.
- This would make negative values of xy as likely as positive values and the sum would be small.
- On the other hand, consider the table above in which high values of X are associated with high values of Y and low values of X are associated with low values of Y.
- You can see that positive values of x are associated with positive values of y and negative values of x are associated with negative values of y.
- In all cases, the product of x and y is positive, resulting in a high total for the xy column.
- Finally, if there were a negative relationship then positive values of x would be associated with negative values of y and negative values of x would be associated with positive values of y.
- This would lead to negative values for xy.
Calculate Pearson's r
- Pearson's r is designed so that the correlation between height and weight is the same whether height is measured in inches or in feet.
- To achieve this property, Pearson's correlation is computed by dividing the sum of the xy column (Σxy) by the square root of the product of the sum of the x2 column (Σx2) and the sum of the y2 column (Σy2).
The resulting formula is:
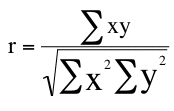

and therefore

An alternative computational formula that avoids the step of computing deviation scores is:


Quiz