Areas of Normal Distributions

From Training Material
Revision as of 01:09, 7 September 2014 by Yolande Tra (talk | contribs) (→‎95% of the Area)
(diff) ← Older revision | Latest revision (diff) | Newer revision → (diff)
Jump to navigation Jump to search
  • Areas under portions of a normal distribution can be computed by using calculus.
  • Since this is a non-mathematical treatment of statistics, we will rely on computer programs and tables to determine these areas.

Example 1

ClipCapIt-140602-150836.PNG

It shows a normal distribution with

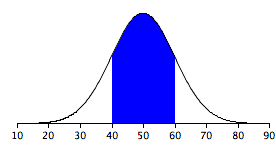
  • a mean of 50
  • a standard deviation of 10

The shaded area between 40 and 60 contains 68% of the distribution.

Example 2

ClipCapIt-140906-210527.PNG

It shows a normal distribution with

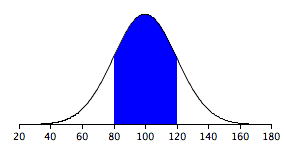
  • a mean of 100
  • a standard deviation of 20.

As in Example 1, 68% of the distribution is within one standard deviation of the mean.


The normal distributions shown in Example1 and 2 are specific examples of the general rule that 68% of the area of any normal distribution is within one standard deviation of the mean.

Example 3

ClipCapIt-140906-210401.PNG

It shows a normal distribution with

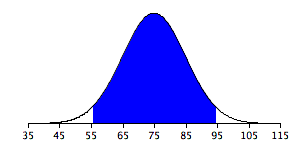
  • a mean of 75
  • a standard deviation of 10

The shaded area contains 95% of the area and extends from 55.4 to 94.6.

95% of the Area

  • For all normal distributions, 95% of the area is within 1.96 standard deviations of the mean.
  • For quick approximations, it is sometimes useful to round off and use 2 rather than 1.96 as the number of standard deviations you need to extend from the mean so as to include 95% of the area.

Quiz
1 A distribution has a mean of 40 and a standard deviation of 5. 68% of the distribution can be found between what two numbers?

30 and 50
0 and 45
0 and 68
35 and 45

Answer >>

35 and 45

68% of the distribution is within one standard deviation of the mean. 40 + 5 equals to 45, 40 - 5 equals to 35


2 A distribution has a mean of 20 and a standard deviation of 3. Approximately 95% of the distribution can be found between what two numbers?

17 and 23
14 and 26
10 and 30
0 and 23

Answer >>

35 and 45

95% of the distribution is within 1.96 standard deviations of the mean. You can round 1.96 to 2 to approximate. 20 - 2(3) equals to 14, 20 + 2(3) equals to 26


3 A normal distribution has a mean of 5 and a standard deviation of 2. What proportion of the distribution is above 3?

Use Normal Calculator here

Answer >>

0.8413

Use the "Calculate Area for a given X" calculator and enter Mean of 5, SD of 2, Above 3. You will get 0.8413.


4 A normal distribution has a mean of 120 and a variance of 100. 35% of the area is below what number?

Use Normal Calculator here

Answer >>

116.15

Var is 100, so SD is 10. Use the "Calculate X for a given Area" calculator and enter Mean is 120, SD is 10, Shaded area is .35. Click below, and you will get 116.15.


5 A normal distribution of test scores has a mean of 38 and a standard deviation of 6. Everyone scoring at or above the 80th percentile gets placed in an advanced class. What is the cutoff score to get into the class?

Use Normal Calculator here

Answer >>

43

Use the "Calculate X for a given Area" calculator and enter Mean of 38, SD of 6, Shaded area of .80. Click below, and you will get 43.05, meaning a score of 43.


6 A normal distribution of test scores has a mean of 38 and a standard deviation of 6. What percent of the students scored between 30 and 45?

Use Normal Calculator here

Answer >>

78.7

Use the "Calculate Area for a given X" calculator and enter Mean of 38, SD of 6, Between 30 and 45. You will get 0.787, meaning 78.7%.