Statistics for Decision Makers - 33.01 - Forecasting
<slideshow style="nobleprog" headingmark="。" incmark="…" scaled="false" font="Trebuchet MS" footer="www.NobleProg.co.uk" subfooter="Training Courses Worldwide">
- title
- 33.01 - Forecasting
- author
- Bernard Szlachta (NobleProg Ltd) bs@nobleprog.co.uk
</slideshow>
Economists。
There are two types of economists:
- those who don't know how to forecast interest rates
- and those who think they know how to forecast interest rates
What is Forecasting。
- Forecasting is the process of making statements about events whose actual outcomes have not yet been observed.
- Usually related to estimation for some variable of interest at some specified future date
- Prediction is a similar, but more general term
What forecast is not。
- Target
- A description of where we think we are heading, based on current assumptions
- Plan
- A set of future actions designed to reach an objective
- Budget
- A sum of money allocated to an activity or action to which an organization has committed itself
Two kind of Forecasting Models。
- Momentum Forecasting Models
- We can predict, but our action will not change the assumptions of the forecast
- Usually mathematical or statistical models
- E.g. solar activity
- Interventions Forecasting Models
- We try to asses the future in order to make decisions which in turn can usually prevent the forecast from happening
- Most of these forecasts are based on judgement
- There is feedback, i.e. the forecast itself changes the future (e.g. if you don’t change course, you will hit an iceberg)
Cassandra。
Cassandra paradox 。
Don't confuse the Cassandra Paradox with Cassandra Syndrome
- Had the Trojans not ignored Cassandra would her prediction have been correct?
Raise your hand if you think her prediction would have been correct?
Business Point of View。
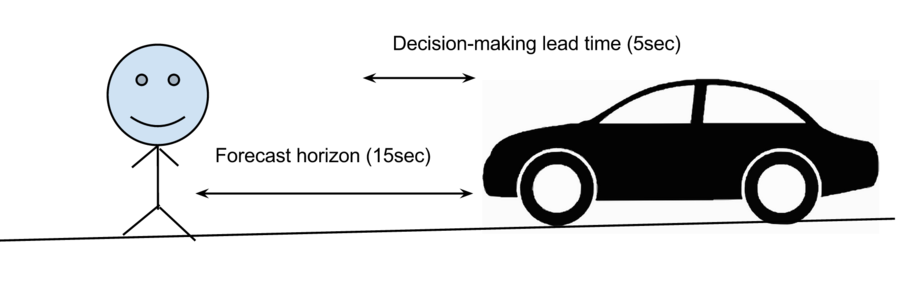
- Decision-making lead time
- The time between taking a decision to do something and the impact being manifested
- Forecast horizon
- The period of time in the future covered by a forecast
- Implications
If the Decision-making lead time is longer than Forecast horizon, do not bother forecasting
Chaos Theory 。
- Deals with dynamical systems that are highly sensitive to initial conditions
- AKA the butterfly effect
- The system can be fully deterministic (as oppose to probabilistic), but can look random
- Managers should recognize the differences between probabilistic, deterministic and chaotic systems
- E.g. organization itself is considered chaotic
Lyapunov time。
- The Lyapunov time is the limit of the predictability of the system
- Examples of the Lyapunov time (without rare events)
- Solar system: 50 million years
- Pluto's orbit: 20 million years
- Organization: from 1 day to hundreds of years
- Scrum Team: 1 day to 30 days
- Hydrodynamic chaotic oscillations: 2 seconds
What is a Model。
- A model is a simplified representation of the world
- Complex models are not usually "better"
Models。
- Mathematical
- E.g. Revenue = Volume * Price
- If we increase speed from 100km/hour to 200km/hour for the train, the travel time will be reduced by 50%
- Statistical
- Regression, Neural Networks, etc...
- People who study 30 mins more per day, with a 95% confidence level, achieve around 20% better results on average
- Judgemental (gut feeling)
- E.g. "I think the recession will last 2 years longer"
- E.g. "Inflation will be around 2% next year"
Some Concepts 。
Risk and Uncertainty
- Risk
- Any deviation from a central forecast where the probability of occurrence can be estimated with a degree of confidence
- Uncertainty
- Any possible deviation from a central forecast where the probability of occurrence cannot be estimated with a degree of confidence
Central vs Range Forecast
- Central forecast
- The "single point" forecast
- Range forecast
- The estimated range of possible outcomes
What to forecast。
Simplest way of forecasting 。
- Important Assumption
- The future will look like the past (no discontinuity happened!)
- Simple mean forecast
- The next customer will spend around £2000 (mean of previous purchases per customer)
- Usually a very big error of forecast (proportional to variance)
- Naive forecast
- Very low error (e.g. stock exchange prices)
- The exchange rate of USD/GBP will be as it was yesterday
Regression model。
A relationship between a dependent variable and one or more independent variables.
E(Y | X) = f(X, β)
- The unknown parameters are denoted as β; this may be a scalar or a vector
- The independent variables, X
- AKA: covariate, explanatory, predictor, control variable
- The dependent variable, Y
Regression Assumptions 。
- The sample is representative of the population for the inference prediction
- The error is a random variable with a mean of zero conditional on the explanatory variables
- The independent variables are measured with no error
- The predictors are linearly independent, i.e. it is not possible to express any predictor as a linear combination of the others. See Multicollinearity.
- The errors are uncorrelated
- The variance of the error is constant across observations (homoscedasticity)
- If not, weighted least squares or other methods might instead be used
Types of Regression 。
- Shape of the function
- Linear
- Non-linear
- Number of predictors
- Simple (one predictor)
- General Multiple Regression
Ordinary Least Square 。
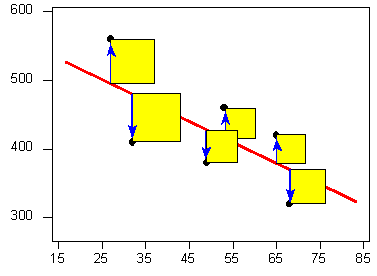
- Finds the line which minimizes squared distance scores from the line
- Uses calculus
Moving Average 。
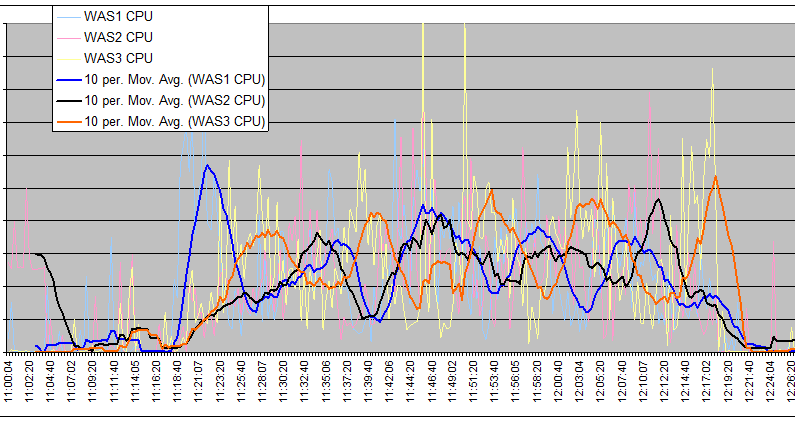
The moving average is the plot line connecting all the (fixed) averages
- The moving average smooths the price data to form a trend following the indicators
- They do not predict the price direction, but rather define the current direction with a lag
- Types
- Simple Moving Average (SMA)
- Exponential Moving Average (EMA)
Simple Moving Average (SMA) 。
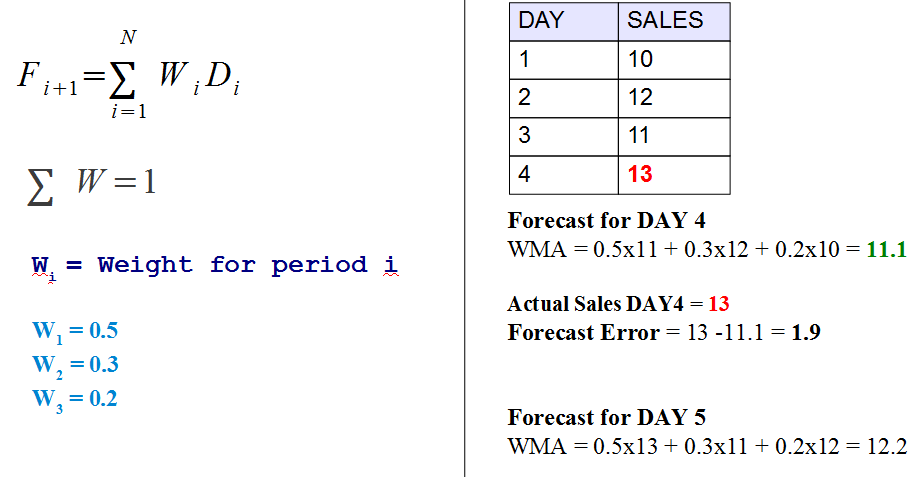
Weighted Moving Average (WMA) 。
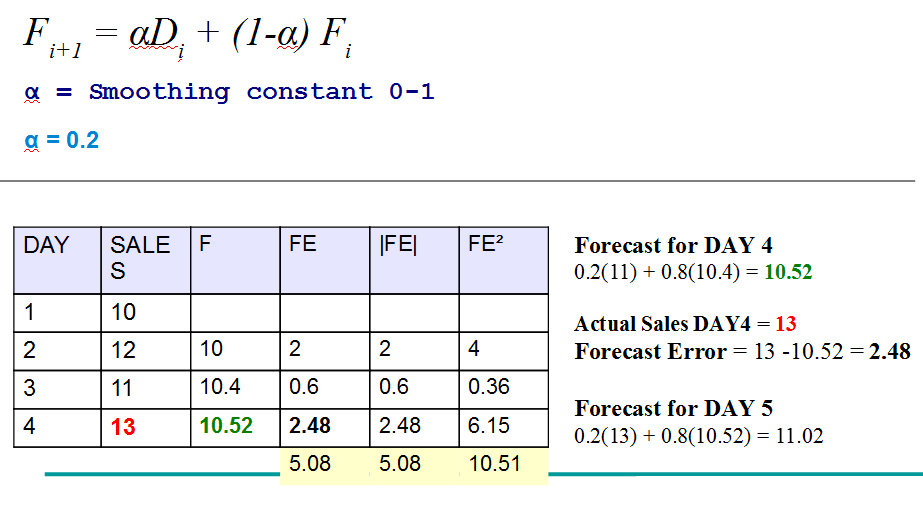
Exponential Smoothing 。
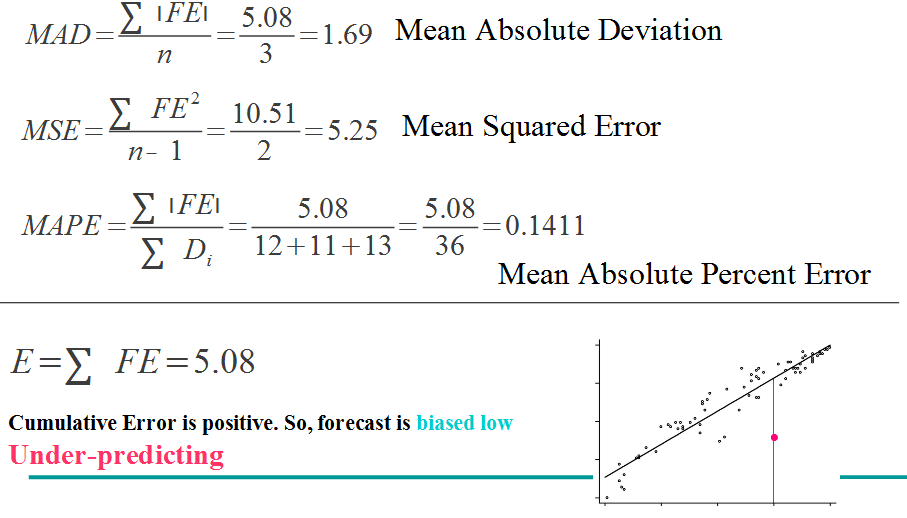
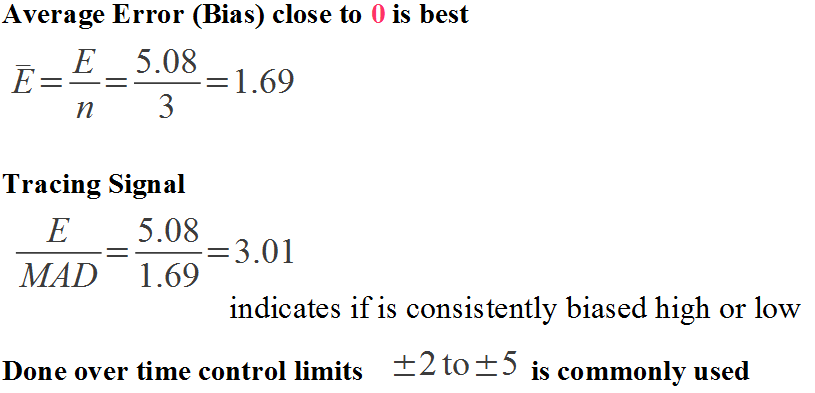
Forecast Error Measures。
Forecast Error Measures 。
Time Series 。
- The data consist of a systematic pattern (usually a set of identifiable components) and random noise (error)
- Can be described in terms of two basic classes of components: trend and seasonality
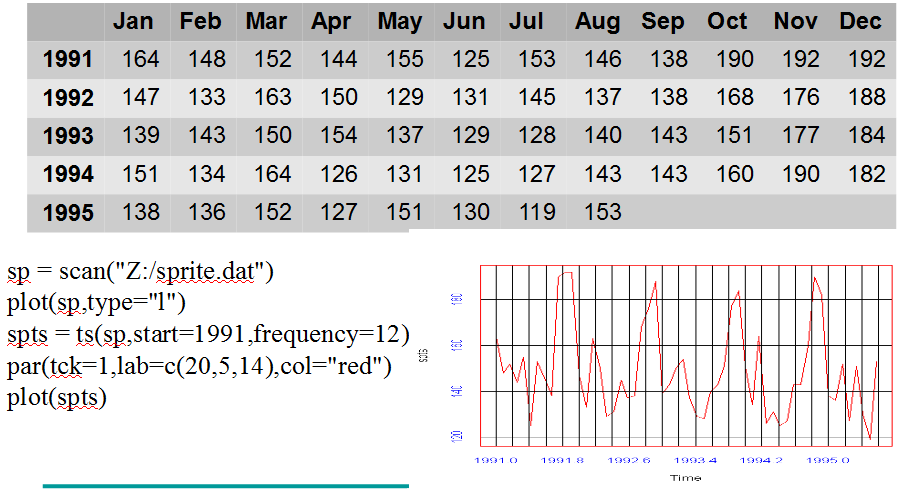
Forecasting Exercises - Sprite Sales 。
Code to paste
sp = scan("Z:/sprite.dat")
plot(sp,type="l")
spts = ts(sp,start=1991,frequency=12)
par(tck=1,lab=c(20,5,14),col="red")
plot(spts)
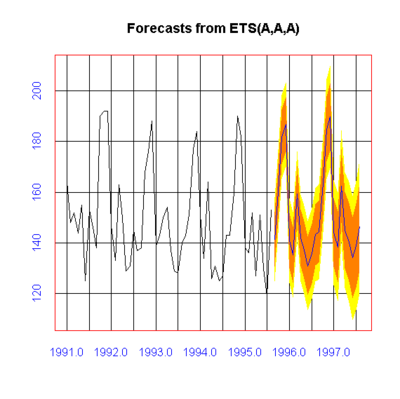
Forecasting ETS。
fc = forecast(spts)
print(fc)
plot(fc)
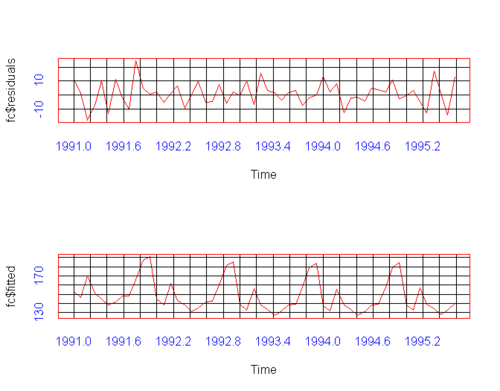
plot(fc$residuals)
lines(fc$fitted)
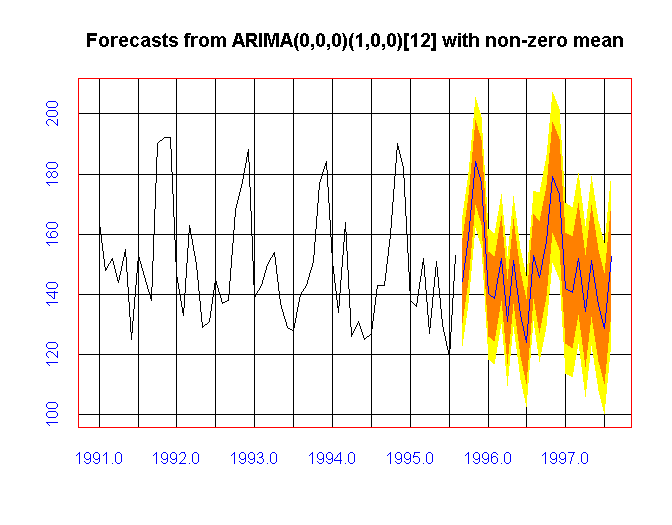
What are the sales of Sprite in Jan 1997 going to be? (Give range and point estimation)
ARIMA (auto)。
ar = auto.arima(spts)
fc = forecast(ar)
plot(fc)
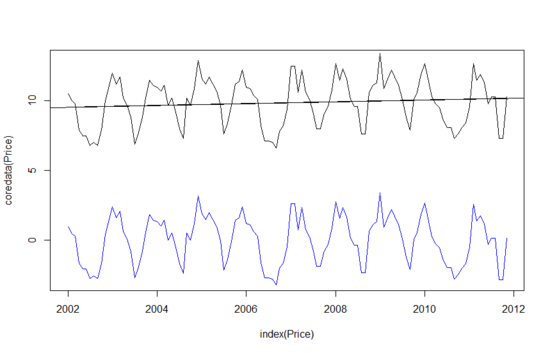
Trend Analysis 。
- Smoothing involves some form of local averaging of data such that the nonsystematic components of individual observations cancel each other out
- The most common technique is moving average (mean or median)
- Fitting a function (usually linear)
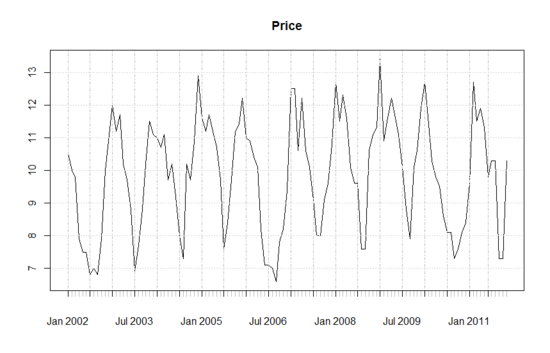
Detrending and ensemble methods。
More: R - Time Series
Judgemental Methods。
- Surveys
- Delphi method
- Scenario building
- Technology forecasting
- Forecast by analogy
Combining Models。
- Usually we use all models (Judgemental + Statistical + Mathematical)
- For example, if we want to predict the revenue, we have price and volume
- Price * volume (mathematical model)
- Finding trends and analysis of seasonality (statistical)
- Scenario for growth - trend slope = 0, slope = 0.2, slope = 0.5
- Multiple models can be used and compared which delivers the best results (smallest error or prediction), it is referred to as an ensemble model

