Timing Diagram⌘

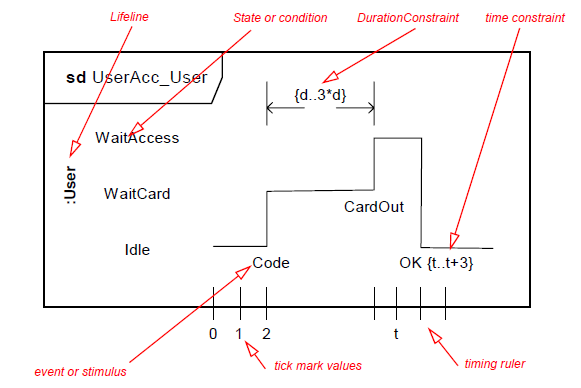
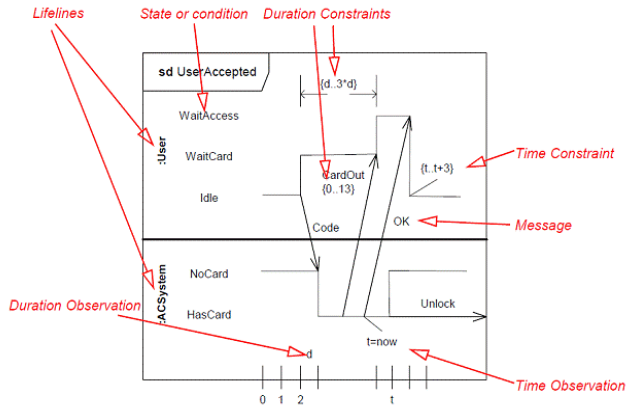
Timing diagrams show change in state of a structural element over time.
General Value Lifeline⌘

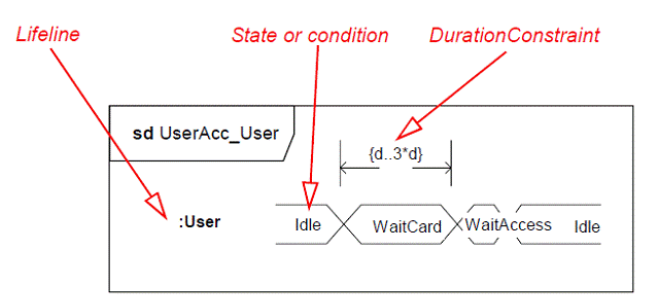
- Shows the value of the connectable element as a function of time.
- Value is explicitly denoted as text.
- Crossing reflects the event where the value changed.
More Lifelines⌘


