Statistics for Decision Makers - 13.02 - Power- Factors Affecting Power
Jump to navigation
Jump to search
- Prerequisites
- Introduction to Power, Example Calculations, Significance Testing, Type I and II Errors, One- and Two-Tailed Tests
Factors affecting power。
Some of the factors are under the control of the experimenter whereas others are not.
- Suppose a math achievement test was known to be normally distributed with a mean of 75 and standard deviation of σ
- A researcher is interested in whether a new method of teaching results in a higher mean
- Assume that, although the experimenter does not know it, the population mean μ is larger than 75
- The researcher plans to sample N subjects and do a one-tailed test of the whether the sample mean is significantly higher than 75
- In this section we consider factors that affect the probability that the researcher will correctly reject the false null hypothesis that the population mean is 75?
- In other words, factors that affect power
Sample Size。
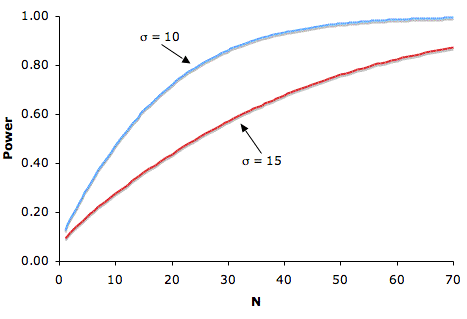
- The larger the sample size, the higher the power
- Since sample size is typically under an experimenter's control, increasing sample size is one way to increase power
- However, it is sometimes difficult and/or expensive to use a large sample size
- The figure below shows the relationship between sample size and power for H0:
μ = 75, real μ = 80, one-tailed α = 0.05, for σ's of 10 and 15.
Standard Deviation。
- The power is higher when the standard deviation is small than when it is large
- For all values of N, the power is higher for the standard deviation of 10 than for the standard deviation of 15 (except, of course, when N = 0)
- Experimenters can sometimes control the standard deviation by sampling from a homogeneous population of subjects, by reducing random measurement error, and/or by making sure the experimental procedures are applied very consistently
Difference between Hypothesized and True Mean。
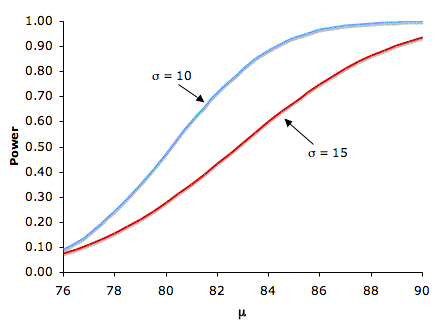
- Naturally, the larger the effect size, the more likely it is that an experiment will find a significant effect
- The figure below shows the effect of increasing the difference between the mean specified by the null hypothesis (75) and the population mean μ for standard deviations of 10 and 15
- The figure below shows the relationship between power and μ with H0:
μ = 75, one-tailed α = 0.05, for σ's of 10 and 15
Significance Level。
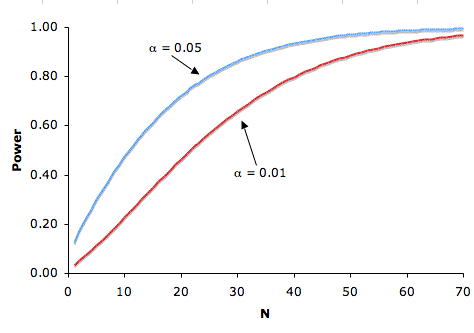
- There is a trade-off between the significance level and the power: the more stringent (lower) the significance level, the lower the power
- The figure below shows that the power is lower for the 0.01 level than it is for the 0.05 level
- Naturally, the stronger the evidence needed to reject the null hypothesis, the lower the chance that the null hypothesis will be rejected
- The figure below shows the relationship between the power and the significance level with one-tailed tests:
μ = 75, real μ = 80, and σ = 10
One- versus Two-Tailed Tests。
- The power is higher with a one-tailed test than with a two-tailed test as long as the hypothesized direction is correct
- A one-tailed test at the 0.05 level has the same power as a two-tailed test at the 0.10 level
- A one-tailed test, in effect, raises the significance level
Within-Subjects vs Between-Subjects Designs。
- Individual differences in subjects' overall levels of performance are controlled
- Subjects invariably will differ greatly from one another
- E.g. in a memory test, some subjects will be better than others regardless of the condition they are in
- Within-subject designs control these individual differences by comparing the scores of a subject in one condition to the scores of the same subject in other conditions
- In this sense each subject serves as his or her own control
- This typically gives within-subject designs considerably more power than between-subject designs
Questions。
Please find the Questions here
Questions
Power | Example Calculations >
< Power Demo 2 | Power Exercises >


