Statistics for Decision Makers - 14.03 - Regression - Standard Error of Estimate
Jump to navigation
Jump to search
Standard Error name confusion 。
- Standard Error of the mean is also used in the context of Sampling Distribution
- Standard Error of the Estimate (SEE) is sometimes simply called S
- Other names
- Standard error of the regression (SER)
- Standard error of the equation (SEE)
SEE interpretation 。
- How wrong the regression model is on average
- Uses the units of the response variable (e.g. kg, meters, etc...), r2 has no unit
- The lower the better (the observations are closer to the fitted line)
- The precision of the predictions
- 95% of the observations should fall within plus/minus 2*standard error of the regression from the regression line (approximation of a 95% prediction interval)
The standard error of the estimate。
- Is a measure of the precision of predictions
- The more scores we have, the higher the SSE
- By dividing them by the number of scores, we "average" the results to have a more standardized measure
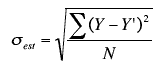 σest : the standard error of the estimate
Y : actual score
Y' : predicted score
Y-Y' : differences between the actual scores and the predicted scores
Σ(Y-Y')2 : SSE
N : number of pairs of scores
σest     : the standard error of the estimate
Y        : actual score
Y'       : predicted score
Y-Y'     : differences between the actual scores and the predicted scores
Σ(Y-Y')2 : SSE
N        : number of pairs of scores

Simple Example。

- You can see that in Graph A, the points are closer to the line then they are in Graph B
- The predictions in Graph A are more precise than in Graph B
Example。
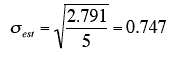
Assume the data below are the data from a population of five X-Y pairs

- The last column shows that the sum of the squared errors of prediction is 2.791.
- Therefore, the standard error of the estimate is:

R output example 。
We try to check whether the number of hours studied can predict GPA (20 scores)
> summary(gpa)
    Hours            GPA
Min.   : 9.00   Min.   :1.300
1st Qu.:15.75   1st Qu.:2.100
Median :21.00   Median :2.800
Mean   :20.30   Mean   :2.700
3rd Qu.:24.25   3rd Qu.:3.225
Max.   :36.00   Max.   :3.800
Call:
lm(formula = GPA ~ Hours, data = gpa)

Residuals:
     Min       1Q   Median       3Q      Max
-1.04103 -0.50375  0.02616  0.35529  0.99023

Coefficients:
            Estimate Std. Error t value Pr(>|t|)
(Intercept)  1.63968    0.45150   3.632  0.00191 **
Hours        0.05223    0.02108   2.478  0.02334 *
---
Signif. codes:  0 ‘***’ 0.001 ‘**’ 0.01 ‘*’ 0.05 ‘.’ 0.1 ‘ ’ 1

Residual standard error: 0.6449 on 18 degrees of freedom
Multiple R-squared:  0.2544,    Adjusted R-squared:  0.213
F-statistic: 6.142 on 1 and 18 DF,  p-value: 0.02334
68% of the observations should fall within plus/minus standard error of the regression from the regression line
R output example 。

Control Chart 。
- Control charts, Shewhart (pron. shoo-heart) charts, process-behavior charts
- Used to determine if a business process is in a state of statistical control
- Lower Control Limit = 2 x Standard Error
- Upper Control Limit = 3 x Standard Error

Common Cause of Variation, Special Cause of Variation。
- Common Cause of Variation
- Usual, historical, quantifiable variation in a system
- Special Cause of Variation
- Unusual, not previously observed, non-quantifiable variation
- Errors
| Real cause: common | Real Cause: special | |
|---|---|---|
| Ascribed to special | Type I error (False positive) | |
| Ascribed to common | Type II error (False negative) |
Influential Values 。

- Blue: regression line for the whole dataset
- Red: regression line if the observation in question is not included (red)
Quiz。
Quiz