R - Basic Statistics
Probability Distributions
Each probability distribution will have four associated functions starting with d, p, q, r. Below normal distribution example
- dnorm - probability density function
- pnorm - density function (cumulative density)
- qnorm - quantile function
- rnorm - random varies
Other distributions will have similar functions, e.g. dt,pt,qt,rt, df, dbinom etc....
Exercises
1. You flip a fair coin 10 times. What is the probability of getting 8 or more heads?
Answer >>
0.0546875
2. Assuming that the human height follows normal distribution with the mean of 174cm and standard deviation of 12cm, what proportion of goods a trouser manufacture should produce for people between 162 and 174cm?
Answer >>
Around 34%
Summarizing Distribution
Parts of this tutorial is based on: http://cran.r-project.org/doc/manuals/R-intro.pdf
> attach(faithful)
> summary(eruptions)
   Min. 1st Qu.  Median    Mean 3rd Qu.    Max.
  1.600   2.163   4.000   3.488   4.454   5.100

> fivenum(eruptions)
[1] 1.6000 2.1585 4.0000 4.4585 5.1000

> stem(eruptions)
 The decimal point is 1 digit(s) to the left of the |
 16 | 070355555588
 18 | 000022233333335577777777888822335777888
 20 | 00002223378800035778
 22 | 0002335578023578
 24 | 00228
 26 | 23
 28 | 080
 30 | 7
 32 | 2337
 34 | 250077
 36 | 0000823577
 38 | 2333335582225577
 40 | 0000003357788888002233555577778
 42 | 03335555778800233333555577778
 44 | 02222335557780000000023333357778888
 46 | 0000233357700000023578
 48 | 00000022335800333
 50 | 0370
hist(eruptions)

hist(eruptions, seq(1.6, 5.2, 0.2), prob=TRUE)
lines(density(eruptions, bw=0.1))
rug(eruptions)
Empirical Cumulative Distribution
plot(ecdf(eruptions), do.points=FALSE, verticals=TRUE)
It seems there are two distributions (as two modes and histogram would suggest). Let us try to split them.
long <- eruptions[eruptions > 3]
plot(ecdf(long), do.points=FALSE, verticals=TRUE)
x <- seq(3, 5.4, 0.01)
Let us fit normal distribution cumulative distribution function
lines(x, pnorm(x, mean=mean(long), sd=sd(long)), lty=3)
And closer look at Quantile-quantile (Q-Q) plot
par(pty="s")
qqnorm(long); qqline(long)
Graphing Probability Distributions
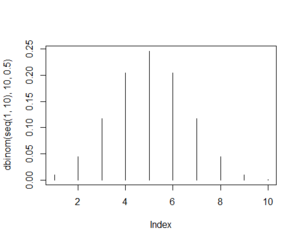
Take example of calculating chances of getting 8 out of 10 heads.
plot(dbinom(seq(1,10),10,0.5),type="h")
old.par <- par(mfrow=c(1, 2))
plot(dbinom(seq(1,10),10,0.5),type="h")
plot(pbinom(seq(1,10),10,0.5),type="h",col=2)
par(old.par)
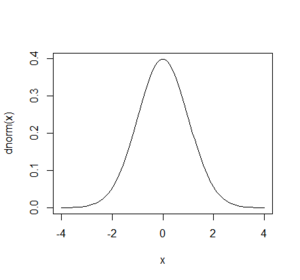
x <- seq(-4,4,length = 1000)
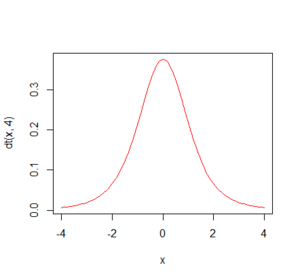
plot(x, dnorm(x),type="l")
curve(dt(x,4),-4,4,add = T,col=2)
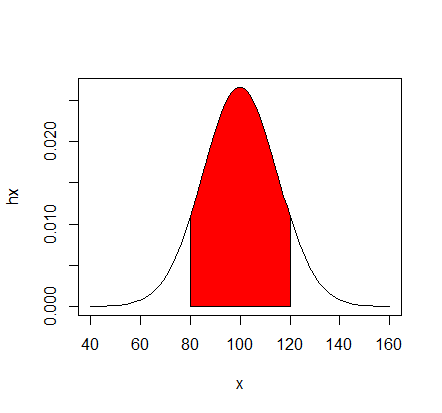
Plotting Area Under normal distribution
- Children's IQ scores are normally distributed with a
- mean of 100 and a standard deviation of 15. What
- proportion of children are expected to have an IQ between
- 80 and 120?
mean=100; sd=15
x <- seq(-4,4,length=100)*sd + mean
hx <- dnorm(x,mean,sd)
plot(x, hx,type="l")
i <- x >= 80 & x <= 120
polygon(c(80,x[i],120),
       c(0,hx[i],0),
       col="red")
- Orders are normally distributed (mean 100, sd=15). What proportion of are expected to have an value between 80 and 120?


