Performance Test Sample Report
Goals of this Report
- To clarify metrics and factors the Drupal application should comply with
- Explicitly state the assumptions
- Describe the process of testing and analysis
- Suggest improvements
Assumptions
These assumptions should be revised by the people closely related to the business and specific part of the application.
Software and Hardware
- CPU
- Network Connection
- Hard Drive
- Memory
- Version of Operating System
- Version of Software
- Web Server
- Database
- Application Server
- Load Balancer
Performance requirements
| Metric | Value | Descriptions |
|---|---|---|
| Average Page Load Time | < 4 sec | |
| Max Page Load Time | < 60 sec | |
| Minimum Throughput | per scenario | |
| Max Number of Registered Users | 30k | |
| Max Concurrent Connection | 2000 | |
| Max Records in the DB | 300k | e.g. 10000 invoices, 3mln customers, etc... |
| Max DB Size | 11GB |
The metrics above are created for commonly used functionality, defined as scenarios used at least once a day by majority of
Scenarios Frequency (Throughput per scenario)
| Scenario (Thread Group) | Expected Normal Throughput in peaks [scenarios/min] (100%, Load Test) | Number of concurrent threads (100%) | Throughout in JMeter plan [scenarios/min] for Load Test (100%) | Number of concurrent threads (200%) | Throughout in JMeter plan [scenarios/min] for Stress Test (200%) |
|---|---|---|---|---|---|
| Anonymous Views a front page | 120 | 10 | 140 | 20 | 180 |
| Anonymous Browse Course catalogue and an outline | 60 | 10 | 50 | 20 | 65 |
| Training Coordinator Edits a node | 2 | 1 | 4 | 2 | 8 |
Performance Testing
Method Used
Due to time restrictions, not all aspect of the application will be covered.
- The business users of the application has been queried about they most frequent activities
- The most frequent activities has been captured in text (human readable) form and are available at: URL here
- The scenarios has been recorded using JMeter v. 2.5.1
Stages
- Single Threaded (running samples sequentially)
- Multi-threaded (100% and 200% of required (assumed)throughput)
- SOAK test, running the test for 48 hours of 100% capacity
In order to prepare reliable test plan, we need to focus on the current utilization from business perspective.
Jmeter should mimic the real world, and try to run as many appropriate scenarios within a specific time as in the real world.
There are a lot of ways of achieving that. There are no the best way. Each case should be considered separately. It means that our test plan should mimic the real world cases as much as possible, but on the other hand we want to keep it simple.
In order to achieve assumed throughput you can change:
- Number of concurrent threads per scenario (Threads)
- Delay between scenarios (a timer at the end of the scenario)
- Delay between samplers (but it should represent the reasonable real world value)
Results (100%)
Samples Response Monitoring (Jmeter results)
Metric    	Value	Comment
Error          Level	0.2%
No of threads	301	Distribution shown in a separate table above
Errors
Label	                                      # Samples	Average	Min	Max   Std. Dev.	Error %
CLI_new_business:11 Sort by created date 2	14	989	609	1,660	290	7.1%
CLI_new_business:11 Select party elipsis 	14	34	18	63	12	7.1%
CLI_new_business:11 Confirm policy selection	14	746	31	1,904	415	7.1%
CLI_new_business:11 Click no case required	14	359	129	731	162	7.10%
Average Response Time Above 4 seconds
Label	# Samples	Average	Min	Max	Std. Dev.	Error %
PMS:01 Select Scheme	8	12,260	10,546	14,137	1,117	0.0%
PMS:03 enter user details pmsuser3	4	5,462	38	21,729	9,392	0.0%
Maximum Responses Time above 60 seconds
Label      # Samples	Average	Min	Max	Std. Dev.	Error %
Scenario1	291	1,183	88	108,534	7,941	0.3%
Scenario2	155	2,482	22	88,698	8,198	0.6%
Scenario2	300	1,697	714	87,309	5,395	0.0%
CLE_customer service:close task	152	1,559	261	85,362	7,557	0.0%
CLE_premium_collections:05 Exit task page	305	590	46	85,259	4,972	0.3%
CLE_policy_alterations:02 Select task step	281	644	8	83,813	4,975	1.8%
The Most Expensive Requests
The column Expensive Samples is calculated as the product of number samples and the average response time (i.e. total time all people have waited for the response)
Label	       # Samples Average Min	Max	Std.Dev. Error %  ExpensiveSamples Expensive Samples %
Scenario10     310	 3,194	 2,088	7,446	790	 0.0%	  990,140	   2.46%
Scenario20     283	 3,465	 9	22,511	2,101	 1.4%	  980,595          2.44%
Scenario30     300	 2,833	 1,041	37,595	2,574	 0.0%	  849,900	   2.11%
Backend resources Results
Web Servers
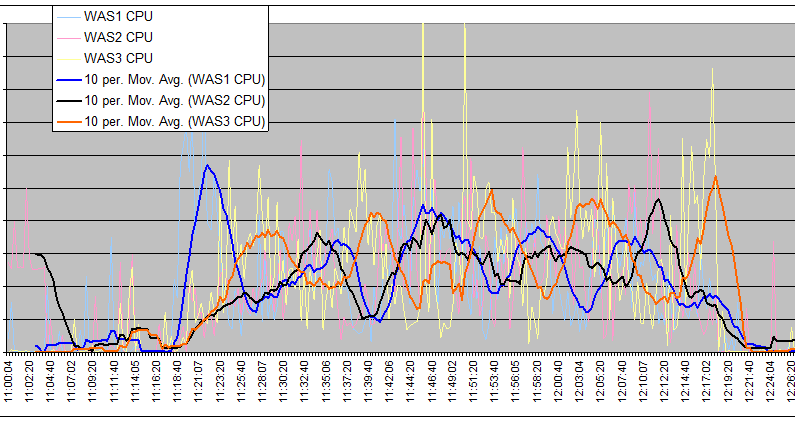
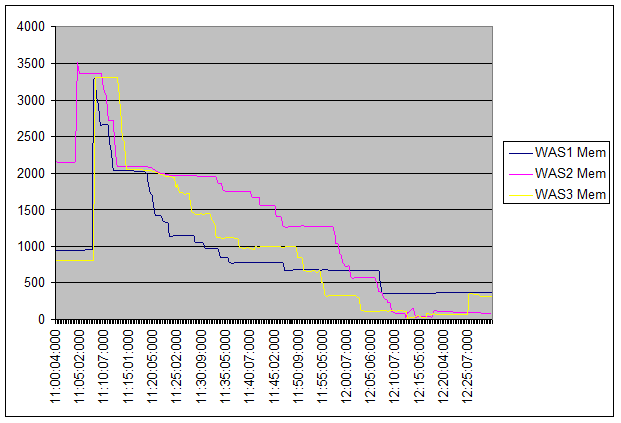
Time Was 1 Was 2 Was 3 Average CPU Utilization (during the test) 27 25 30


