Market Forecasting
What is Forecasting
- Forecasting is the process of making statements about events whose actual outcomes have not yet been observed.
- Usually related to estimation for some variable of interest at some specified future date
- Prediction is a similar, but more general term
What forecast is not
- Target
- a description of where we think we are heading, based on current assumptions
- Plan
- a set of future actions designed to reach an objective
- Budget
- a sum of money allocated to an activity or action to which an organization has committed itself
Prediction
- A prediction is a statement about the way things will happen in the future, often but not always based on experience or knowledge
- Prediction may be a statement that some outcome is expected, while a forecast may cover a range of possible outcomes
Two kind of Forecasting Models
- Momentum Forecasting Models
- We can predict, but our action will not change the assumptions of the forecast
- Usually mathematical or statistical models
- Interventions Forecasting Models
- We try to asses the future in order to make decisions which in turn can usually prevent the forecast to realize
- Mostly Judgemental forecast
- There is a feedback, i.e. the forecast itself changes the future (i.e. if you don’t change the course, you will hit an iceberg)
Business Point of View
- Decision-making lead time
- time between taking a decision to do something and the impact being manifested
- Forecast horizon
- period of time in the future covered by a forecast
What is a Model
- A model is a simplified representation of the world.
- Complex models are not usually "better"
Models
- Mathematical
- e.g. Revenue = Volume * Price
- If we increase speed from 100km/hour to 200km/hour for the train, the travel time will be reduced by 50%
- Statistical
- Regression, Neural Networks, etc...
- People who study 30 min more pay date, with 95% confidence level, achieve around 20% better results on average
- Judgemental (gut feeling)
- e.g. "I think the recession will last 2 years longer"
- e.g. "The inflation will be around 2% next year"
Assumptions>Model>Output
TODO: Move Pictures from slide 9 (market_forecasting.odp)
Risk and Uncertainty
- Risk
- any deviation from a central forecast where the probability of occurrence can be estimated with a degree of confidence
- Uncertainty
- any possible deviation from a central forecast where the probability of occurrence cannot be estimated with a degree of confidence
Central vs Range Forecast
- Central forecast
- the "single point" forecast
- Range forecast
- the estimated range of possible outcomes
What to forecast
Important Assumption
The future will look like the past (no discontinuity happened!)
Correlation and Regression
- Correlation
- tells us whether we can predict the value of one variable if we know other variable (for example, if we know the number of hours studied, we can predict the exam results)
- Correlation tells us only about the strength and the direction
- R = 0 - no correlation, we cannot predict anything
- R < 0 - the more we study the less chance for passing an exam
- R > 0 - the more we study the more chance for passing an exam
- The closer R is to 1 the more certain our prediction is
- Regression model allow us to quantify the prediction
Regression model
- relationship between a dependent variable and one or more independent variables.
E(Y | X) = f(X, β)
- The unknown parameters denoted as β; this may be a scalar or a vector.
- The independent variables, X
- AKA: covariate, explanatory, predictor, control variable
- The dependent variable, Y.
Regression Assumptions
- The sample is representative of the population for the inference prediction
- The error is a random variable with a mean of zero conditional on the explanatory variables.
- The independent variables are measured with no error.
- The predictors are linearly independent, i.e. it is not possible to express any predictor as a linear combination of the others. See Multicollinearity.
- The errors are uncorrelated
- The variance of the error is constant across observations (homoscedasticity). If not, weighted least squares or other methods might instead be used.
Types of Regression
- Shape of the function
-
- Linear
- Non-linear
- Number of predictors
-
- Simple (one predictor)
- General Multiple Regression
Ordinary Least Square
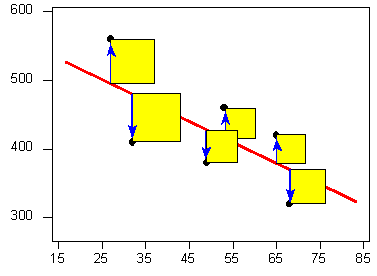
- Finds the line which minimizes squared distances scores from the line
- Uses calculus
Exercise
CorrelationAndRegression.xls in repository
Moving Average
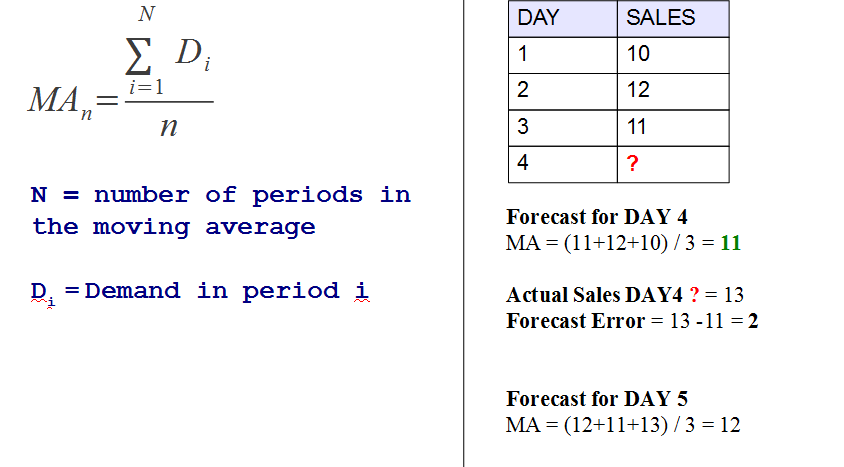
- The moving average is the plot line connecting all the (fixed) averages
- Moving average smooth the price data to form a trend following indicator
- They do not predict price direction, but rather define the current direction with a lag
- Types
-
- Simple Moving Average (SMA)
- Exponential Moving Average (EMA)
Simple Moving Average (SMA)
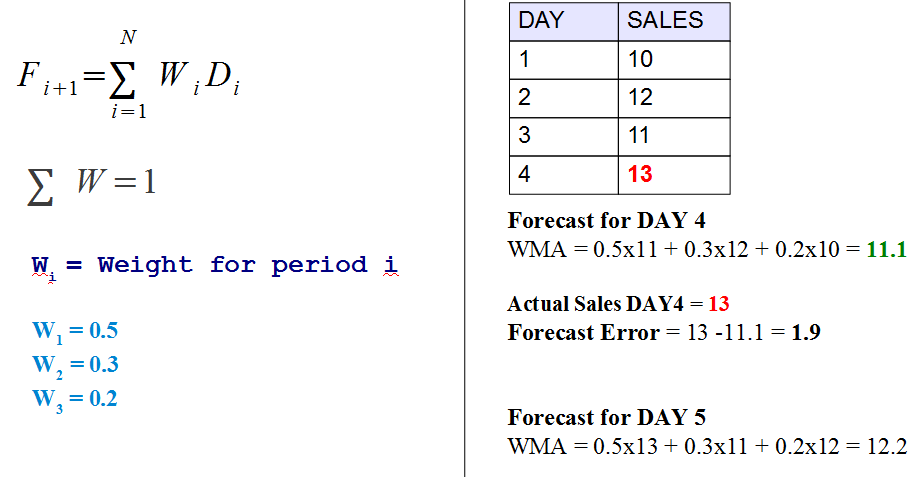
Weighted Moving Average (WMA)
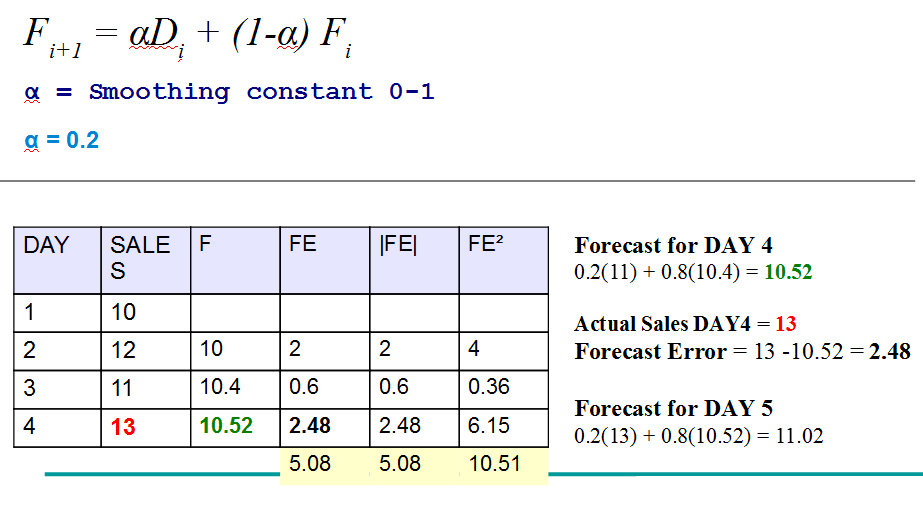
Exponential Smoothing
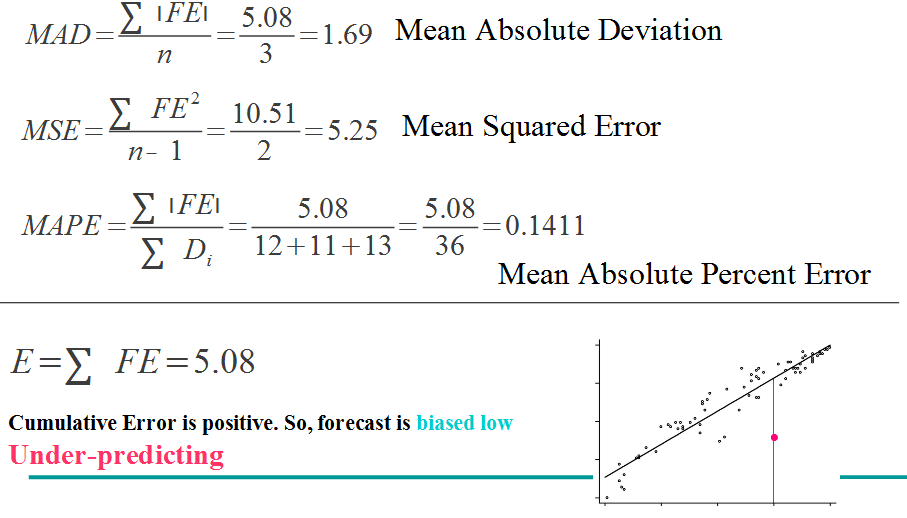
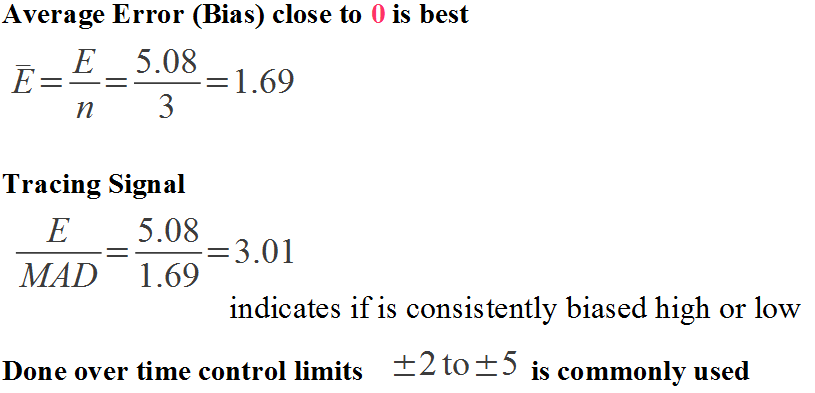
Forecast Error Measures
Forecast Error Measures
Exercises
For MA(2) and ES(a=0.7) calculate:
- Tracing Signal
- Bias
- Which method has the lowest bias
- Which method has the highest bias
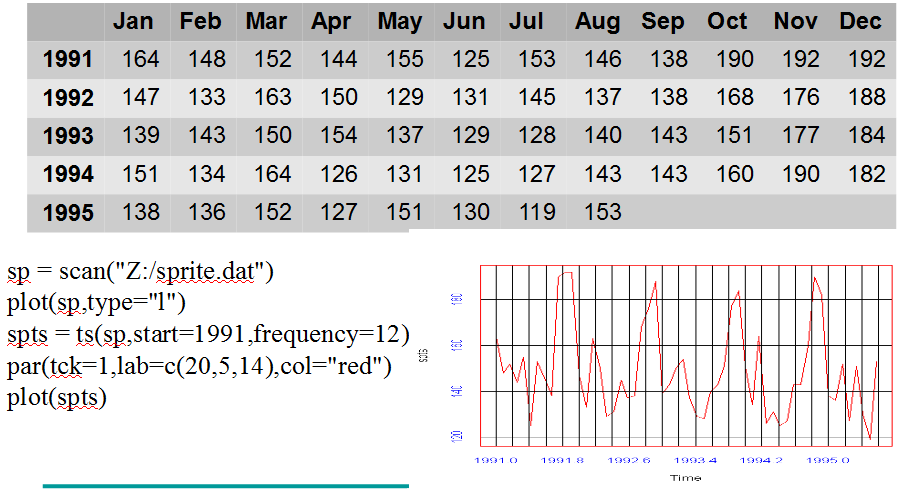
Forecasting Exercises - Sprite Sales
Code to paste
sp = scan("Z:/sprite.dat")
plot(sp,type="l")
spts = ts(sp,start=1991,frequency=12)
par(tck=1,lab=c(20,5,14),col="red")
plot(spts)
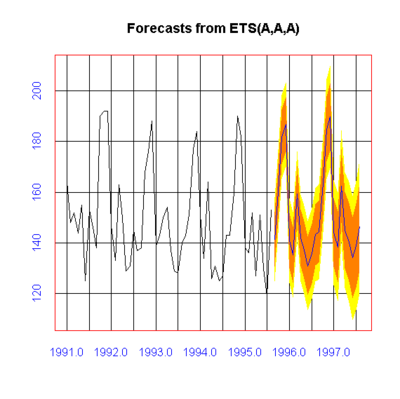
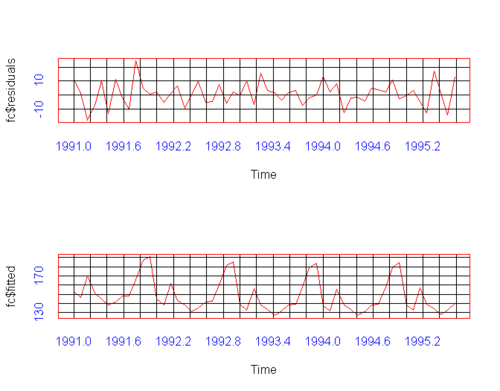
Forecasting ETS
fc = forecast(spts)
print(fc)
plot(fc)
plot(fc$residuals)
lines(fc$fitted)
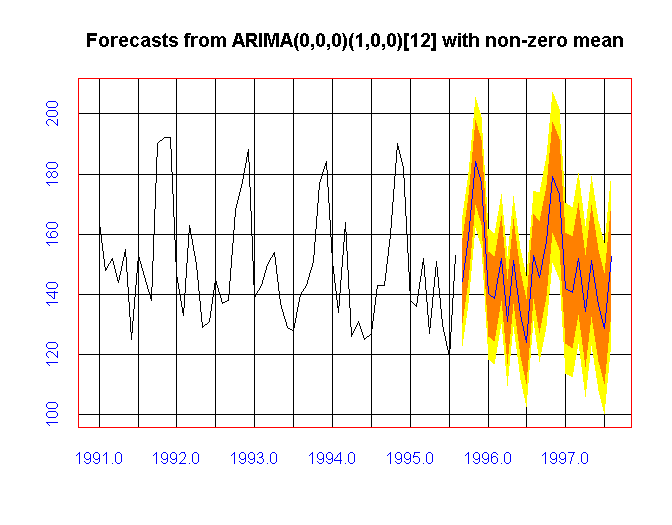
What sales of Sprite in Jan 1997 are going to be? (give range and point estimation)
ARIMA (auto)
ar = auto.arima(spts)
fc = forecast(ar)
plot(fc)
Quiz - Question 1
What is the advantage of N-period moving averages method over simple mean forecasting method?
- (a) easy to use
- (b) not sensitive to a shift in recent data
- +(c) needs space to maintain only the "N" most recent periods of data points
- (d) none of the above
Quiz - Question 2
Question 2. The demand for certain items is given for 6 consecutive months as follows: 45, 50, 42, 40, 48, 52. What is the forecast demand for 7th month if three period moving average is applied?
- (a) 46.2
- +(b) 46.66
- (c) 46.4
- (d) 50
Judgemental Methods
- Surveys
- Delphi method
- Scenario building
- Technology forecasting
- Forecast by analogy
Surveys
- You ask representative group of people about their opinion about the probable outcome
- Can be combined with proper statistical analysis (notably hypothesis testing like "is the people prediction was by pure chance or is significant")
Delphi Method
- Structured communication technique, originally developed as a systematic, interactive forecasting method which relies on a panel of experts.
- Usually experts answer questionnaires in two or more rounds
- After each round, a facilitator provides an anonymous summary of the experts’ forecasts from the previous round as well as the reasons they provided for their judgements
- Thus, experts are encouraged to revise their earlier answers in light of the replies of other members of their panel.
- It is believed that during this process the range of the answers will decrease and the group will converge towards the "correct" answer.
- The process is stopped after a pre-defined stop criterion e.g.:
- number of rounds
- achievement of consensus
- stability of results
- the mean or median scores of the final rounds determine the results
- Also known as Planning Poker in Scrum (except anonymity)
Exercise
- What will be the US GBP growth in the next year?
Steps
- allow each delegate to write down their estimation with explanation
- make the files public (anonymity)
- got with the second round
Scenario Building
- Scenario is a set of parameters of the model (e.g. inflation, GDP, etc...)
- Usually judgementally estimated and optionally followed by risk
- Good example: http://en.wikipedia.org/wiki/Beyond_the_Limits
Scenario Example
- UK GBP growth
- growth (5%)
- slow growth (1%)
- double dip recession (-3%)
Combining Models
- Usually we use all models (Judgemental + Statistical + Mathematical)
- For example, we want to predict the revenue, we have price and volume
- price * volume (mathematical model)
- finding trend and analysis of seasonality (statistical)
- scenario for growth - trend slope = 0, slope = 0.2, slope = 0.5
Exercise
- Using the Spectrum Analysis example, build 3 scenarios (optimistic, most probably i.e. trend doesn't change, pessimistic) and try to estimate the revenue of the company in the year 2004
- What about the risk and forecast range? Assume 95% of confidence level for the revenue.
Technology Forecasting
- We can know surprisingly accurately how the future technology will look like
- Moors Law (number transistors double very 2 years)
- Battery capacity/weight ratio law (doubling roughly every 20 years)
- Technology forecasting doesn't count for discontinuities and limits which have to assessed separately
Exercise
- How much petrol will a car use per 100km in next 10 years?
- How much electricity a washing machine will use in the next 10 years?
- What will be average usage of water for dish washers in the next 10 years?
Forecast by Analogy
- Forecast by analogy method assumes that two different kinds of phenomena shares the same model of behaviour.
- For example, one way to predict the sales of a new product is to choose an existing product which "looks like" the new product in terms of the expected demand pattern for sales of the product.
- "Used with care, an analogy is a form of scientific model that can be used to analyze and explain the behavior of other phenomena."
Exercises
How do you you think prices for space travel will behave in the future? What analogy would you use? What about:
- literacy rate in India
- Birth rate in Ethiopia?
- Quality of Chinese goods?
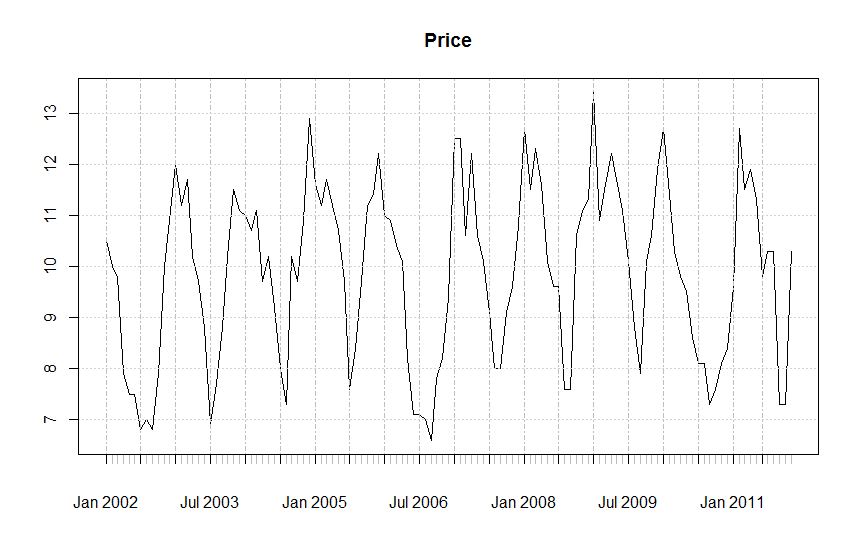
Time Series
- data consist of a systematic pattern (usually a set of identifiable components) and random noise (error)
- can be described in terms of two basic classes of components: trend and seasonality
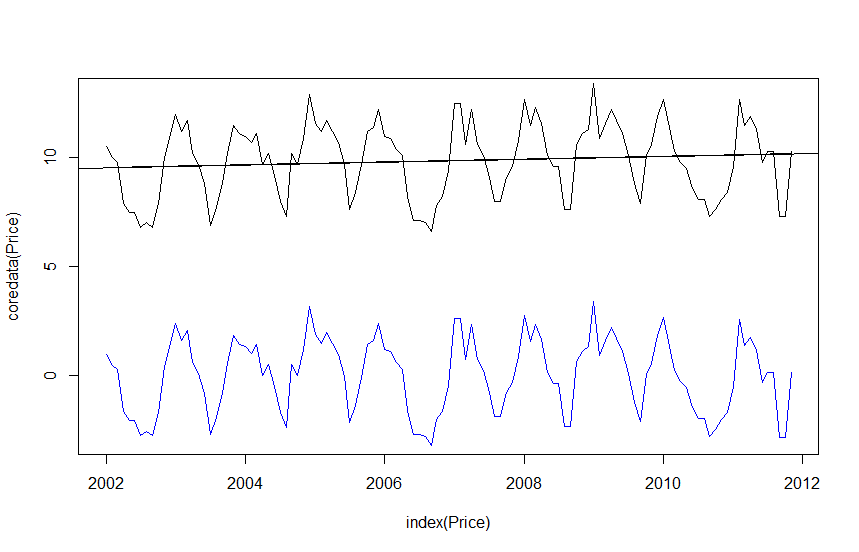
Trend Analysis
- Smoothing involves some form of local averaging of data such that the nonsystematic components of individual observations cancel each other out
- The most common technique is moving average (mean or median)
- Fitting a function (usually linear)
Detrending
More: R - Time Series

