R - Regression: Difference between revisions
Jump to navigation
Jump to search
mNo edit summary |
(No difference)
|
Latest revision as of 03:13, 6 March 2016
Linear regression is an approach to modelling the relationship between a dependent variable y and one or more explanatory variables X.
- One explanatory variable -> simple regression
- Many explanatory variables -> multiple regression
- Multiple correlated dependent y variables are predicted -> multivariate linear regression
Linear regression is usually used for:
- Prediction/forecasting
- Quantify the strength of the relationship between y and the Xj
Implementation:
- Least squares
- Least absolute deviations
- Ridge regression
Regression Model
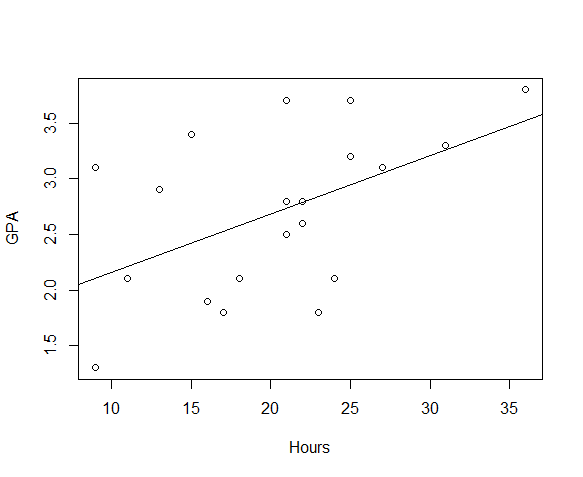
Hours Studying and GPA
"How well does the average number of hours studying predict GPA?"
- Predictor variable - Hours
- Response (criterion) variable - GPA
 # Read the data
 gpa <- read.table("http://training-course-material.com/images/8/86/Study-time-gpa.txt",h=T)

 # Pearson correlation
 cor(gpa)

 # Draw a scatter plot
 plot(gpa)

 # Create a model
 m <- lm(GPA ~ Hours, data=gpa)

 # Show the model
 m

 # Validate the model
 summary(m)

 # Draw the model
 abline(m)

 # What would be a score for studding for 34 hours
 p <- predict.lm(m,data.frame(Hours = c(34)))
 p
Exercises
Using linear regression, find the predicted post-test score for someone with a score of 43 on the pre-test.
http://training-course-material.com/images/8/84/Pre-post-test-scores.txt

