Values of the Pearson Correlation: Difference between revisions
Jump to navigation
Jump to search
Ahnboyoung (talk | contribs) mNo edit summary |
(No difference)
|
Latest revision as of 18:30, 25 May 2014
Pearson's correlation
- The Pearson product-moment correlation coefficient is a measure of the strength of the linear relationship between two variables.
- It is referred to as Pearson's correlation or simply as the correlation coefficient.
- If the relationship between the variables is not linear, then the correlation coefficient does not adequately represent the strength of the relationship between the variables.
- The symbol for Pearson's correlation is "ρ" when it is measured in the population and "r" when it is measured in a sample.
- Because we will be dealing almost exclusively with samples, we will use r to represent Pearson's correlation unless otherwise noted.
Pearson's r
Pearson's r can range from -1 to 1.
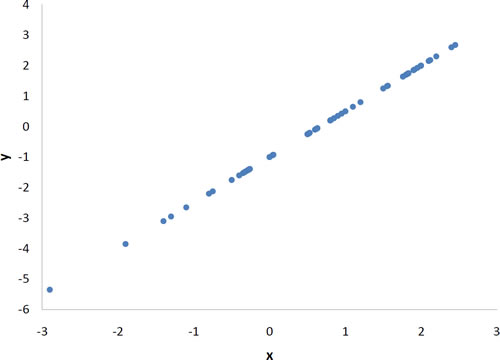
- r = 1 indicates a perfect positive linear relationship between variables
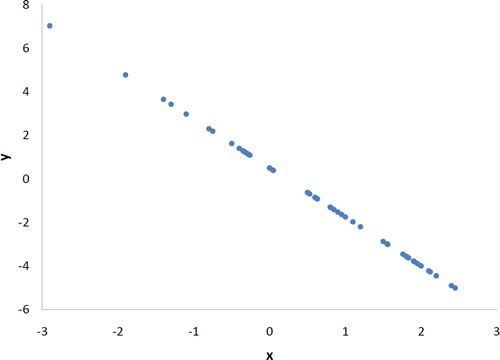
- r = -1 indicates a perfect negative linear relationship between variables
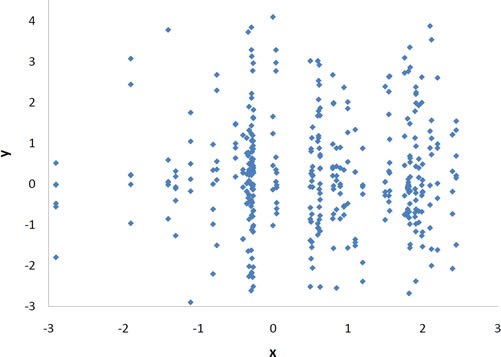
- r = 0 indicates no linear relationship between variables
r=1
A perfect positive linear relationship, r = 1.
r=-1
A perfect negative linear relationship, r = -1.
r=0
A scatter plot for which r = 0. Notice that there is no relationship between X and Y.
-1<r<1
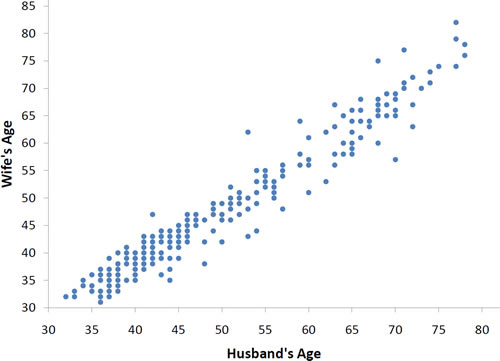
With real data, you would not expect to get values of r of exactly -1, 0, or 1.
- The data for spousal ages shown in the figure below and described in the introductory section has an r of 0.97.
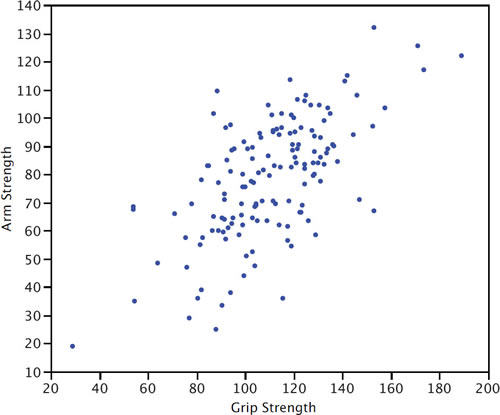
- The relationship between grip strength and arm strength depicted in the figure below (also described in the introductory section) is 0.63.
Quiz
